The Human Costs of Practicing in a Profit-Driven System
Physicians for a National Health Program, March 17, 2026
Table of Contents
- Executive Summary
- Introduction
- Background Research
- Purpose Statement
- Study Design
- Analysis
- Systemic Priorities That Favor Profit Maximization Undermine Patient Care and Health Outcomes
- Financialized Health Care Structures Deepen Disparities for Marginalized and Underserved Populations
- Physicians Experience Moral Injury When Corporate and Institutional Pressures Conflict with Professional and Ethical Standards
- Oregon Case Study
- Study Limitations
- Recommendations for Meaningful Change
- Appendix
To view a printable PDF version of this report, click HERE.
To view a two-page printable handout, click HERE.
To view our comprehensive Toolkit to help you take action in the fight against financialization, click HERE.
Executive Summary
This project used narrative research methods—including physician focus groups, a national survey, physician interviews, and patient focus groups—to examine how health care financialization harms patient care and drives physician moral injury. Physicians described a system that routinely obstructs timely, evidence-based, patient-centered care through practices such as prior authorization, coverage denials, productivity quotas, and excessive documentation. Among 1,207 surveyed physicians, 47% often or always felt unable to provide optimal care due to inadequate time, and 44% reported being unable to deliver medically necessary treatment because of insurance barriers.
When clinicians know what care is needed but are blocked by insurers or corporate administrators, moral injury predictably follows. Forty-five percent of physicians often or always felt unable to provide the best possible care, and 68% experienced moderate or severe distress as a result. The consequences extend beyond clinicians to patients and the stability of the healthcare system. Twenty-five percent of surveyed physicians are currently considering leaving a job due to moral distress, and 27% have already left a position for this reason, contributing to clinic closures, loss of services, and longer wait times for care.
Physicians also described how financialized health care compounds systemic racism and inequity, with 57% reporting moderate or severe distress related to systems that fail to treat vulnerable patients with dignity. As insurers and corporate entities prioritize profitability, care for patients with complex medical or social needs is often devalued or restricted. This exacerbates existing disparities, reinforcing structural inequities along socioeconomic, racial, and geographic lines. The resulting system undermines principles of justice and fairness, deepening health inequities and compromising the ethical foundation of healthcare delivery.
A system driven primarily by profit and shareholder interests will inevitably fail both patients and providers, and must be fundamentally restructured. While reforms and increased regulation can address some problems, the industry has repeatedly shown a strong capacity to undermine or bypass such regulations.
Ultimately, to safeguard the future of American healthcare, a publicly financed, single-payer universal health care program is required. Implementing such a system would ensure that care is organized around medical need rather than profit—and that current barriers to care such as copayments, deductibles, prior authorizations, and medical debt would become relics of the past.
At the same time, financing reform alone will not solve every problem in American health care. Building a truly patient-centered system will require both universal public financing and reforms to the delivery system. Addressing corporate consolidation, financialized ownership of hospitals and medical practices, and inequitable distribution of capital investment will be essential to making universal coverage translate into real improvements in access, equity, and quality of care.

Introduction

Over the past three-quarters of a century, the U.S. healthcare industry has increasingly shifted focus away from the provision of care and toward the extraction of wealth, a trend legal scholars Erin Fuse Brown and Hayden Rooke-Ley have termed “health care financialization.” (Fuse Brown and Hall, 2024). They define health care financialization as “the shift in the primary objective of health care institutions from the production of patient and community health to the extractive production of wealth for equity owners and management” (Journal of Health Care Law and Policy, 2025). This is the definition of health care financialization we will use as we explore the impact of this transformation on patients and physicians.
Although this wealth extraction has yielded substantial profits for investors, it has also imposed a profound and frequently life-threatening impact on patients, especially those from historically marginalized communities. Furthermore, healthcare professionals and providers find themselves in a challenging position: how can they remain dedicated to delivering evidence-based, optimal medical care amidst pressures from their employers, the insurers upon whom they rely to get reimbursed for their provided care, or the pharmaceutical and device manufacturers, all of whom are seeking to maximize profits?
Research to date has insufficiently evaluated the impact of these dramatic shifts in how healthcare is financed on individual physicians. In particular, the conceptualization of physician burnout has failed to capture the reality of practicing medicine in this profit-driven system.
It is well documented that as physicians lose autonomy and as they spend more time on administrative tasks, they report symptoms of burnout. Tasks, such as the completion of prior authorizations, a tool insurers use to reduce the amount of care for which they are financially responsible, contribute to the experience of burnout in nearly 90% of physicians (Burden et al, 2024). A recent survey from the American Medical Association (AMA), found that one-in-five physicians were planning to retire in the next 2 years, an indictment of the current state of the US healthcare system (Henry, 2022).
As noted earlier, dogma would lead us to believe that burnout alone is responsible for physician dissatisfaction and the exodus of physicians from the practice of medicine. However, boilerplate solutions for burnout, such as reduction in duty hours, wellness initiatives, and team-building exercises, have failed to meaningfully alter these trends (Dzeng and Wachter, 2020). The lack of efficacy of wellness initiatives is unsurprising to scholars like Dr. Wendy Dean and Dr. Simon Talbott, who argue that moral injury is a more accurate description of the problems facing physicians in today’s healthcare landscape (Talbott and Dean, 2018). Physician moral injury arises when physicians are prevented from delivering evidence-based, optimal patient care due to systemic constraints beyond their control – particularly those imposed by profit-driven goals of the health care industry.
Put another way, moral injury occurs when clinicians are forced to take actions that conflict with their values. Many physicians find themselves practicing in direct conflict with their own values, the values that led them to a career in healthcare in the first place, and are coerced into aligning with the directives of a profit-driven system (Appendix Figure 4 Quote2.f). This conflict in values, exacerbated by health care financialization, invariably leads to moral distress and injury for physicians. Ultimately, patients are the ones harmed, especially when they seek care in moments of need and encounter treatment shaped by systemic revenue-maximizing constraints rather than their physician’s medical judgment. As a result, prescriptions to combat burnout are predictably insufficient to contend with the harms perpetuated by the profit-driven healthcare system; they are in fact counterproductive as they obscure the root causes of physician dissatisfaction and patients pay the price.
Without a complete understanding of the drivers of moral injury and a willingness to make meaningful structural change, the ability of policymakers and stakeholders to address our healthcare crisis will remain limited.
Background Research
Before examining how financialization affects physicians and patients, it is important to clarify how physician distress is typically understood; and why prevailing explanations fall short. Much of the current conversation centers on burnout, a term that emphasizes workload, efficiency, and individual coping. While this framing captures real symptoms, it does little to explain why distress persists despite widespread wellness and resilience initiatives, or why many physicians report being forced to practice in ways that conflict with their professional values. This section introduces moral injury as an alternative framework, one that more directly reflects how institutional and policy choices shape the everyday realities of medical practice. Drawing on peer-reviewed research, policy analysis, and expert commentary; this analysis examines the macroeconomic forces influencing physician autonomy, patient welfare, and equitable care delivery.
Conceptual Foundations: Distinguishing Moral Injury from Burnout
The construct of moral injury originated in military psychiatry to describe the psychological wounds sustained when individuals perpetrate, witness, or fail to prevent acts that transgress their deeply held moral beliefs (Shay, 1995). Dean and colleagues (2018) adapted this framework to health care, arguing that physicians experience moral injury when systemic constraints force them to provide care they know to be inadequate, inequitable, or harmful.
Moral injury is conceptually distinct from burnout, though the two interact (Thibodeau et al., 2023). Burnout comprises emotional exhaustion, depersonalization, and diminished personal accomplishment, which are typically attributed to demand-resource mismatches (Maslach & Jackson, 1981). Critically, burnout frameworks implicitly locate the problem within the individual and prescribe individual-level interventions: resilience training, mindfulness, and/or counseling.
Moral injury, by contrast, reflects systemic and institutional failures. It occurs when physicians are forced to act against their professional oath, creating a profound moral conflict when they cannot deliver care aligned with their ethical and medical obligations (Buchbinder et al., 2024). The phenomenological experience differs: whereas burnout manifests as exhaustion, moral injury produces guilt, shame, loss of meaning, and erosion of professional identity (Maguen & Griffin, 2022).
This distinction carries significant implications. If physician distress fundamentally reflects moral injury (i.e., the systematic inability to fulfill professional obligations) then individual-focused interventions will prove insufficient. Solutions must address the organizational and systemic conditions generating these moral conflicts (Dean et al., 2024).
The Financialization of U.S. Health Care
Understanding physician moral injury requires an understanding of how clinical practice operates within a radically transformed health sector. Financialization of health care promotes the transformation of entities like hospitals and clinics into assets from which the financial sector can accumulate capital. This has led to the emergence of financial-sector ownership, demands for short-term profit growth, and distribution of profits to outside parties (Bruch, Roy & Grogan, 2024). This results in a priority shift from the production of high-quality patient care to the generation and extraction of wealth.
Impact on Patient Care
Patients experience fragmented care, reduced access, and diminished therapeutic relationships when treatment decisions, visit length, and documentation are driven by productivity benchmarks rather than individualized needs. Delays, denials, and administrative barriers interfere with timely diagnosis and treatment, eroding trust between patients, clinicians, and the health care system (KFF 2023). And, as has been extensively reported following private equity acquisition, patient outcomes suffer when financial motives supersede the pursuit of clinical excellence (Borsa et al., 2023).
Impact on Health Equity
Financialization disproportionately harms marginalized populations. Productivity metrics penalize complex, time-intensive care, putting patients with greater needs at a disadvantage. Systemic racism compounds these dynamics. Bailey and colleagues (2017) document how structural racism, the totality of ways societies foster discrimination through mutually reinforcing systems, shapes health outcomes.
For physicians committed to health equity, the daily inability to address social determinants constitutes a profound moral wound. Physicians aware of how housing instability, food insecurity, and economic inequality shape health outcomes confront their powerlessness against systemic threats and must grapple with a recognition that they cannot provide care their professional ethics otherwise demand (Dzeng & Wachter, 2019).
Impact on Physician Autonomy
Physician autonomy, as delineated by the American Medical Association (AMA) Code of Medical Ethics, is the fundamental right of physicians to retain clinical authority over patient care, free from “corporate intrusion” or external pressures that could compromise professional judgment. This autonomy operates on two levels: 1) at the individual (clinical) level, it enables practitioners to make specific diagnostic and treatment decisions tailored to patients’ unique needs without undue micromanagement by administrative or financial mandates; 2) at the collective (professional) level, it affirms the medical community’s right to self-regulate by establishing ethical standards and entry requirements, as well as providing science-based diagnostic and treatment guidelines (American Medical Association, 2016). Ultimately, this framework ensures that physicians act as independent moral agents whose primary allegiance remains with the patient rather than the financial interests of third-party participants in the healthcare system.
The AMA Code of Ethics explicitly prohibits the corporate practice of medicine (CPOM), theoretically safeguarding physician autonomy by stipulating that only licensed physicians, rather than commercial enterprises, are authorized to engage in medical practice (Subbiah & Scheffler, 2025). To circumvent this regulation, health insurers and private equity firms employ a “Friendly Professional Corporation/Management Services Organization (PC/MSO)” model, whereby a licensed physician owns a Professional Corporation (PC), and an MSO within a larger corporate entity manages assets, branding, and records. Through Management Services Agreements (MSAs), the MSO receives administrative fees and ensures physician compliance with corporate policies, thereby exerting influence over practice operations and emphasizing profit and efficiency metrics. While physicians remain legally responsible, their professional autonomy is significantly limited, if not eliminated. Throughout much of the United States, the doctrine of the Corporate Practice of Medicine has, in effect, become “a doctrine in name only,” rendered largely “toothless” by decades of lax enforcement and strategic circumvention via “friendly PC” arrangements that enable corporate control over clinical activities (Brown & Hall, 2024).
Physicians rely on a wealth of knowledge and experience accrued over years of medical training, supported by clinical practice guidelines, to provide evidence-based, compassionate care for their patients. The tools of financialization, including prior authorizations, denials of care, and productivity incentives, substitute the decisions of untrained industry administrators for a physician’s judgment, eroding the physician’s sense of autonomy. Automated algorithmic denials of care that were recommended by a physician based on a patient’s specific needs and supported by robust, evidence-based guidelines from medical societies exemplify insurers’ disregard for both individual and collective physician autonomy. A majority of physicians transitioning from traditional practices to direct-to-consumer practices cite loss of autonomy to third-party control as a major contributor to this decision (Pickern, 2025).
Towards a Greater Understanding of Moral Injury
Physician moral injury cannot be understood in isolation from structural forces reshaping health care. Financial-sector penetration, erosion of professional autonomy, and subordination of patient welfare to profit imperatives interact to produce conditions where physicians are routinely compelled to provide care they know to be inadequate, inequitable, or inconsistent with their professional oath.
Recognizing moral injury in medicine prompts a discussion on how to rectify the structural deficiencies of our healthcare infrastructure. Unlike burnout, which implies a depletion of physician resilience, moral injury provides a conceptual framework for understanding the underlying forces behind that depletion. This redefinition bears practical significance: if the root cause is systemic, then the solutions must likewise be systemic. Individual resilience alone is insufficient to resolve contradictions embedded in the structural foundations of healthcare. Addressing physician moral injury necessitates organizational reforms that reestablish clinical autonomy, policy modifications that limit financialization, and a commitment to equitable healthcare delivery. These issues are encompassed within the scope of health systems governance, rather than solely workforce management. The moral injury experienced by physicians indicates profound flaws in the organization and financing of U.S. healthcare, warranting urgent and serious consideration from health system leaders, policymakers, and the general public.

Purpose Statement
This project arose to better understand the impact of rampant financialization on patients and physicians and the root causes of physician dissatisfaction, to explore the effects of health care financialization on physicians, and to add patients’ perspectives to the discussion about the shift in healthcare towards maximal wealth extraction.
Through focus groups, surveys, and interviews, this report by Physicians for a National Health Program (PNHP) uses narrative methodologies to explore the rise in financialization in healthcare and its impact on the growing problem of moral distress and injury among healthcare professionals who find their ability to provide optimal care curtailed by the profit motives of insurers and health systems.
The research also included a case study, performed in collaboration with Health Care for All Oregon (HCAO), to analyze the dynamics in a state experiencing rapid growth in corporate acquisitions of physician groups that is pitted against fierce grassroots advocacy opposing health care financialization. This case has policymaking implications for the newly created Universal Health Plan Governance Board (UHPGB). Patient focus groups also explored the lived experiences of patients in relation to the impact of health care financialization on cost, access, quality, trust, and equity.
This report includes a review of the study’s design, data collection and analysis, and actionable recommendations targeting three audiences: national policymakers and legislators, healthcare and physician advocacy groups, and Oregon’s Universal Health Plan Governance Board.
Support for this project was provided by the Robert Wood Johnson Foundation. The views expressed here do not necessarily reflect the views of the Robert Wood Johnson Foundation.
Study Design
To address gaps identified in the existing literature, this study employed a sequential explanatory mixed-methods design (Maguen and Griffin, 2022). Data collection included physician focus groups, a national physician survey, in-depth physician interviews, and patient focus groups, allowing for triangulation of perspectives on moral injury, financialization, and equity in healthcare.
Moral Injury Survey and Development
Three physician focus groups were conducted and facilitated by one of two trained physician moderators. Participants included both members and non-members of Physicians for a National Health Program. Discussions explored physicians’ experiences of moral injury, the financialization of healthcare, and systemic racism. Findings from these focus groups guided the creation of a survey to investigate potential contributors to and severity of physician moral distress and injury and to identify potential interview participants. The survey adapted 8 items from the Measure of Moral Distress for Health Care Professionals (MMD-HP) (Epstein et al., 2019) and added 14 new questions to capture system-level pressures, financial constraints, and administrative burdens shaping moral distress (Appendix Study Materials). Additionally, the survey asked respondents to share whether they had previously considered leaving or have left a position due to moral distress, were presently contemplating leaving a job due to moral distress, and their self-rated level of burnout.
Survey Distribution and Respondents
The physician survey was distributed using a non-random, multi-modal recruitment approach rather than probability-based sampling. PNHP conducted outreach through its professional networks, as well as through medical societies, including the Society of General Internal Medicine (SGIM), the American College of Physicians (ACP), and state and local medical societies, which shared the survey with their members. Additional outreach occurred through PNHP listservs and social media platforms. To further expand participation, a snowball methodology was employed; survey respondents were encouraged to share the survey with colleagues in their professional networks.
A total of 1,886 individuals completed the survey. Among respondents, 1,465 identified as physicians, and 1,330 reported being board-eligible or board-certified (i.e., post-residency or fellowship training). Detailed demographic, professional, and practice-setting characteristics of survey respondents are provided in the accompanying materials (Appendix Figures 1-4).
Physician Qualitative Interviews
The qualitative component included semi-structured interviews with physicians, informed by both the literature and insights from clinicians and researchers. Interview guides were developed in consultation with a senior qualitative research advisor from Cambridge Health Alliance’s Health Equity Research Lab (Appendix Study Materials). Seven thematic domains were included in the interview guide: professional trajectory, physician autonomy, financialization in healthcare, equity and marginalized populations, coping strategies, moral injury, future outlook, and recommendations.
Physician Recruitment
Thirty interviews were conducted with actively practicing physicians. Participants were recruited from survey respondents who indicated openness to being interviewed and met inclusion criteria: a minimum of six years in clinical practice and a patient population composed of more than 50% low-resource patients. Eligible participants were contacted via email and provided informed consent through DocuSign. Interviews were conducted virtually via Zoom, lasted approximately one hour, and were screen recorded. The Pearl and Cambridge Health Alliance Institutional Review Boards reviewed and approved study procedures and interview materials.
Data Management and Analysis
All interviews were transcribed verbatim using Zoom’s built-in transcription function and deidentified prior to analysis. Deidentified transcripts were uploaded into Dedoose qualitative analysis software. Access to identifiable data was restricted to designated members of the research team in compliance with IRB requirements; other team members accessed only deidentified or aggregated data.
A six-step thematic analysis approach (Braun & Clarke, 2006) was used, including familiarization with the data, code generation, theme development, theme review, finalization, and reporting. Coding combined deductive and inductive approaches to balance existing theoretical frameworks with emergent findings. Dedoose facilitated code application and data management.
Reflexivity and Bias Minimization
Prior to coding, all coders completed a reflexivity exercise examining their perspectives and familiarity with moral injury, healthcare financialization, and healthcare inequities. Coders received training from the senior qualitative researcher and completed interrater reliability testing, achieving substantial to high agreement (Cohen’s Kappa = 0.74–0.89). The senior qualitative researcher led theme development and synthesis of findings.
Patient Focus Groups
Patient focus groups were conducted to examine experiences of healthcare access and delivery, particularly in relation to financialization and corporatization. These groups were designed to capture patients’ perspectives on how systemic economic forces influence care quality, access, and decision-making.
Patient Recruitment, Enrollment, and Consent
Participants were recruited through community flyers, outreach to local organizations, physician referrals, social media, and snowball sampling. A purposive sampling strategy was used to ensure demographic and experiential diversity. Interested individuals completed an online eligibility survey and participated in a pre-screening phone call.
Due to the identification of “imposter participants” early in recruitment, enhanced verification procedures were implemented. Eligibility was confirmed via phone-based plausibility checks (county, zip code, and local healthcare facility) and visual verification of city residency during the consent process. Verification materials were securely logged and deidentified, with only city of residence retained.
Study Procedures
Patient focus groups were conducted using a semi-structured facilitation guide designed to elicit patient narratives through open-ended questions. The guide covered six thematic domains: general perceptions of healthcare; insurance and access; quality of care; trust and transparency; interactions with providers and institutions; and future outlooks (Appendix Study Materials). The facilitation guide was developed based on a review of the literature and input from the study’s advisory board. Focus group sessions were conducted in both online and in-person formats. Online sessions were hosted via Zoom and included participants from Chicago, New York City, and across the state of Oregon, while an in-person session was held in Eugene, Oregon. All focus groups were moderated by trained facilitators and lasted between 90 and 105 minutes.
To ensure confidentiality and secure participation, participants were instructed to refrain from sharing personal identifiers and to maintain the confidentiality of information discussed during the sessions. Online participants were required to keep their video cameras on throughout the session; this requirement was communicated during the verbal consent process, and participants explicitly agreed to this.
All sessions were recorded using Zoom’s automated recording and transcription features. Transcripts were password-protected to safeguard participant confidentiality. Participants received a $50 USD cash payment as compensation for their time.
Data were analyzed using a thematic analysis approach following the six-step framework outlined by Braun and Clarke (2006), which included data familiarization, initial code generation, theme development, theme review, theme definition, and report production.
Analysis
Systemic Priorities that Favor Profit Maximization Undermine Patient Care and Health Outcomes
The financialization of healthcare has increasingly redirected clinical practice away from patient well-being and toward revenue maximization. Treatment decisions, visit length, and clinical documentation are often driven by productivity benchmarks, billing codes, and insurer-imposed constraints rather than individualized patient needs and evidence-based medical judgment. Among 1,207 practicing physicians, 47% report often or always feeling unable to provide optimal care due to inadequate time, 35% feel they are often or always required to care for more patients than for whom they can safely care, 43% often or always feel required to overemphasize tasks and productivity or quality measures at the expense of patient care, and 51% often or always experience excessive documentation requirements that compromise patient care (Appendix 2.L).
Patients experience the consequences of these pressures directly. As one participant described, “My mother-in-law needs two knee [replacements]…but very specifically was told…nope, your insurance company does not cover that. Even though…the doctor says that’s what she needs…we’re not covered.” This is not an isolated experience; patients repeatedly face delays, denials, and administrative barriers that disrupt timely diagnosis and care. Indeed, of the 1,207 physicians who completed the survey, 44% often or always felt that lack of availability or insurance approval for services such as post-acute care or physical therapy stymied their ability to provide patients with medically necessary services.
Experiences like these are not unique. Patients routinely face delays, denials, and administrative barriers that interfere with timely diagnosis and treatment. Another patient explained, “[The doctor] will…say it’s not covered…let’s go to Plan B…or they’ll spend hours of paperwork trying to get it through. And my doctor has said, yeah, I’m gonna try really hard to get this for you, but I don’t know if I can…”. These insurer-imposed obstacles prioritize cost containment and revenue optimization over patient-centered care, creating system wide incentives to restrict care: “…the standard response is rejection or more hoops and red tape…because the more barriers there are, the less the insurance companies will have to pay out.” (appendix Quote 2.h). The cumulative effect is fragmented care, reduced access to necessary services, and diminished therapeutic relationships. Patients’ frustration is reflected in their descriptions of the system as “convoluted, scary, corrupt, failed, expensive, frustrating, dysfunctional, inequitable, and haywire” and their characterization of providers as “defeated, burned out, and overwhelmed.” Optimism about the system was both rare and guarded.
Physicians experience financialization as moral distress. Of 1,207 practicing physicians surveyed, 45% said they often or always felt unable to provide patients with the best possible care, and 68% reported experiencing moderate or severe distress as a result of this incapacity. Administrative burdens and insurer constraints undermine clinicians’ ability to practice medicine in accordance with medical society guidelines, their professional judgment, and ethical commitments (Appendix Quote 2.i). Of those same 1,207 doctors, 35% attribute their challenges in optimally caring for their patients to healthcare administrators’ or insurers’ zeal in reducing costs, with 62% experiencing moderate or very high levels of distress because of this. One internal medicine physician explained, “Patients and people outside the medical community will see doctors as part of the problem…we are not happy with the fact that…we can’t get you the medicine that you need. We would rather be on the patient’s side…than be on a team with the insurance company.”
Nearly 1-in-4 surveyed physicians specifically experienced moderate or severe distress due to the overemphasis on patient satisfaction scores, which they perceived hampered their ability to speak candidly with their patients about the limitations and failures of the healthcare system (Quote 2.j.). Another general internal medicine physician described the constant emotional burden: “There’s a low-level frustration with the system that’s kind of always there. It is frustrating, it’s demoralizing…when you see how long it takes people to get things that they need.” This general internist was not alone. Nearly half of practicing physicians surveyed felt they were often or always making diagnostic or treatment recommendations that they knew their patients would not be able to pursue because of either limitations of the healthcare system or healthcare-associated financial toxicity; for 7-in-10 of these physicians, this provoked moderate or severe levels of distress.
The impact of moral distress extends beyond individual physician well-being with significant impact on patient’s access to healthcare. Data from patient focus groups described how financial pressures imposed by insurers and corporate owners push physicians out of practice, destabilizing local health care systems: “…United Healthcare created that. They said [to doctors], if you’re unwilling to see this many more patients per day, cut your appointments down to 20 minutes…if you can’t follow this system, then you’re out…When Optum bought Oregon Medical Group, they lost 30% of their physicians, and they all left the area.” The significant proportion of physicians’ leaving their jobs is not unique to Oregon. PNHP’s national survey data confirm that 25% of physicians are currently considering leaving a job due to moral distress, and 27% have previously left a job for the same reason.
Understaffing, limited time for patient care, and insufficient resources not only intensify physician moral distress but also compromise patient outcomes. Among 1,207 physicians surveyed, 45% often or always encountered lack of resources, equipment, or bed capacity that compromised patient care, and 43% found that their health systems leadership often or always failed to supportively respond when such failures occurred. In contemplating these situations, three-in-five practicing physicians surveyed experienced moderate or severe levels of distress. As one resident physician reflected on the human cost, “…these patients…they come to you for help. And you know that you have less tools and less resources…not even [to] get them healthy, but to save their life…just because the system…decides that they deserve less.” By prioritizing revenue over patient needs, the financialized system undermines compassionate and holistic care, erodes trust between patients and clinicians, and ultimately diminishes care quality and health outcomes.

Financialized Health Care Structures Deepen Disparities for Marginalized and Underserved Populations
Financial and structural forces in the U.S. healthcare system create inequities in access and outcomes among racially minoritized populations and migrant communities. Physician focus groups, survey results, and interviews clearly show that physicians struggle with systemic racial and immigration status-based bias, noting disparate treatment and substandard care. Among the practicing physicians we surveyed, 57% reported moderate or severe distress related to working in healthcare systems that failed to treat vulnerable patients with dignity and respect. Specifically, 41% of surveyed physicians often or always felt complicit in the structural racism those systems perpetuated. One-in-four surveyed physicians felt they often or always abutted power hierarchies within patient care teams, medical units, or healthcare institutions that compromised patient care.
To further explore how the financialization of healthcare reinforces systemic racism, the study intentionally sought to interview physicians who reported caring for populations in which over 50% of patients were under-resourced. This approach ensured that the perspectives of clinicians serving historically marginalized communities were captured. Physicians with whom we spoke recognized limited access to resources, discriminatory practices based on race and immigration status, and misdiagnoses along with inaccurate treatments driven by racial bias as critical factors that conspired to produce poorer health outcomes. One of the interviewed physicians described the healthcare system’s ”implicit bias… where [they] know that people who are minorities, particularly black people, or people who have an accent of any kind…[are] treated differently.”
Throughout the interviews, many physicians expressed a clear awareness of; and deep discomfort with; the clear relationship between race and underinsurance and/or lack of insurance. One interviewee reflected what many of our participants expressed, “[T]he initial factor is the insurance …there’s a lot of other social factors and identities that play into what…insurance people have…and what…jobs they have access to, that gets them good insurance.” One emergency medicine physician described the ethical challenges of providing care in a system that discriminates based on insurance. “Hospitals are motivated by getting good reimbursement for their services … so [for] people that are on Medicaid or don’t have insurance, there’s not a financial incentive [for institutions] to give [them] the best care possible.”
Interviewed physicians reported feeling complicit with our flawed system. A pulmonary/critical care physician shared how those who are uninsured or who have tenuous immigration status are seemingly “punish[ed]… because they don’t have the right documents, because they don’t have the right amount of money, because they don’t have the right insurance.” When more than $5 trillion is spent on healthcare annually in the U.S., the aforementioned pulmonary/critical care doctor strained to see the fiscal and moral logic in their healthcare organization providing those who are socially and economically vulnerable dialysis only twice weekly when doing so almost guarantees those individuals will “get readmitted right [away] because they weren’t getting adequately dialyzed.” One of the internal medicine residents worried that in an “under-resourced hospital… people are vulnerable to racial bias, have a language barrier, have no ability to pay, [such that] it can be dangerous for them, and it can be … institutionalizing and carceral as well.”
A combined medicine and pediatrics specialist summarized the issues and frustrations expressed by many: “You have a system that is predicated on profit maximization. Even the nonprofits engage in profit maximization…we had patients that couldn’t afford their inhalers. They couldn’t afford basic medications. They couldn’t afford insulin… Many of our racial and ethnic minorities… are on the bottom end or on the lower end of the socioeconomic scale, they have fewer financial resources…So then you’re sitting there chewing out your patient because they’re not taking their diabetes medications? But they can’t afford them. They can’t afford it.”
Another interviewee spoke of patients mislabeled with the diagnosis of intellectual disability. “They had thick accents that made it hard to understand them, but when I asked them basic questions, they had a fund of knowledge that suggested that they didn’t have an intellectual disability.” They went on to describe the impossibility of “creating a good treatment plan” with the wrong diagnosis and “not enough time.”
A psychiatrist interviewed spoke at length about the persistence of race-based misdiagnosis of schizophrenia with dire outcomes for patients. “Patients with the same psychiatric presentation, if they were black, were diagnosed as schizophrenia, and people who were white were diagnosed with bipolar disorder”. It matters “because you use different medications …and the prognosis is different…White people would get the diagnosis of bipolar disorder, and (doctors) would be hopeful and… put a lot of resources, whereas black people would get the diagnosis of schizophrenia, and they would get this [mind-numbing] medication…and they were …written off….Race renders patients more vulnerable to misdiagnosis which … leads to hopelessness and a lack of therapeutic zeal on the part of the treaters. [T]hat’s where we are complicit because we don’t say, ‘Stop! This is the wrong diagnosis. This kid doesn’t have this.’”
Physicians Experience Moral Injury When Corporate and Institutional Pressures Conflict with Professional and Ethical Standards
Physicians both earlier and later in their careers emphasized that they were drawn to medicine by a desire to care with skill and with compassion for individuals in their time of illness and suffering. “We go into medicine to help people. I truly love my patients,” a surgeon proclaimed. A pulmonary/critical care physician shared that they saw medicine as a “tool for social justice,” while a general internal medicine doctor noted that they “love[d] to be able to advocate for patients…because…everyone deserves equal healthcare, and the patients need to be able to take the medications we prescribe.” Those visions of what healthcare should be did not prevent physicians from being realistic regarding the profession in which they entered. “Doctors have always had a stressful job,” noted a pediatrician. A psychiatrist in turn observed, “Every field of medicine has things that it can’t do. We can’t save everybody…But the bigger problem is that for a lot of [patients] the treatment that’s possible falls far short of the treatment that you know would work.”
Physicians’ prevailing sense of duty and of service-mindedness has collided with a growing realization that the financial priorities of the healthcare system generally—and of the organizations for which they work specifically—conflict with and impede their ability to provide patients with the best possible clinical care (Appendix Quote 2.g.). Half of the practicing physicians surveyed felt betrayed by a healthcare system that hindered their ability to provide good patient care, and a similar proportion specifically characterized their employer as often or always prioritizing financial goals over the physician’s desire to provide the best patient care. For 62% of surveyed physicians, these issues caused moderate to severe levels of distress. As one family medicine physician noted, “I…feel extremely cheated…The system has subtly and progressively and then sinisterly changed in ways that defraud me and my patients.” Another family medicine physician declared, “My organization does not place value on me as a human employee or the relationships that I build with my patients. It is really dispiriting.”
Feelings of frustration and anger abound as physicians with whom we spoke articulate a multi-level critique of the system which prevents them from being able to provide timely, affordable, and evidence-based care to their patients. They feel exasperated with being asked to do more with less during clinic visits that are 12 minutes long and with a focus on quality measures that “seem to be in conflict with addressing the needs or concerns that are more immediate for a [patient].” (Appendix 2.i.) As one general internal medicine doctor bitterly shared, “[Health systems leadership] didn’t care if you killed the patient, they didn’t care if you harmed the patient. They cared about ‘did you sign up for the patient within 1 minute of their arrival?’” Physicians bristled at hospitals that prioritize revenue generation. They expressed anger at being pestered by health systems administrators who are fixated on early discharges and throughput without recognizing how short-sighted standards of “efficiency” and “productivity” threaten patient-centered care. For one-in-two physicians who completed our survey, these issues often or always colluded with the administrative burdens erupting from insurance prior authorization and denials of care to wear them down. As one family medicine physician noted, “Patients are not the center, and they [insurance companies] don’t even, at this point, lie about it…It’s all about the codes. I didn’t realize I became an ICD-technologist. But apparently, I’m that, and I’m a CPT-ologist and an E&M-codeologist…[T]hat’s not what I got into medicine for, to learn all this nonsense.”
Physicians who we surveyed and interviewed witness the ways in which healthcare organizations ration care based on insurance status and fixation on lucrative service lines. One emergency medicine doctor said, “[Health systems] are more interested in wealthy people that have good insurance that are going to bring them money, whether that’s cancer treatment, orthopedics, [or] neurology.” They are irate at payors and a society that balks at providing individuals with mental illness vocational rehabilitation that would allow them to “have a life other than being a chronic mental patient, and that wouldn’t cost hundreds of thousands of dollars a year,” as stated by a psychiatrist interviewed for this study.
Physicians “want to stay in [their] career…and want to love work,” a family medicine physician reflected, but as a pulmonary/critical care doctor expressed, they grapple with a recurrent sense of “complicity in taking part in a system that doesn’t feel patient-centered.” Across the practicing physicians who completed our survey, the overall severity of moral distress varied widely (see Appendix Figure 4) with a minimum overall score of 0 for five physicians and a score of 352 (the maximum possible) for eight physicians. We found that the mean overall severity of moral distress score was 143, and the median was 136. For context, the overall severity of moral distress reported in the study validating the original MMD-HP was 96 (Epstein et al. AJOB 2019). Recognizing the cohorts of physicians surveyed between that study and the current study are different and acknowledging the different years in which the surveys were administered (2017 versus 2025), we hypothesize that some of the increase in severity we found is driven by the addition of questions highlighting systemwide contributors to moral distress that are distinct from potentially morally distressing situations occurring at the clinician-patient, patient-care team, or intra-institutional levels.
The physicians we interviewed observe several responses in which they and their colleagues engage to cope with this moral distress and moral injury. Some become numb. An emergency medicine doctor shared how some colleagues “shut down that part of [themselves] to no longer notice [injustices], because it’s the only way to survive.” A family medicine doctor struggled to reconcile the cognitive dissonance of being seen as “a productivity center for some financial institution,” while a general internist described feeling worn down by having to jump through the hoops and hurdles placed in front of them and their patients by a “system that’s designed to be obstructive.” Others contort their practices to try to get patients the care they need. As noted by an internal medicine doctor, that might mean becoming savvy with billing and documentation practices and grappling with “hav[ing] to do a thing [they] don’t want to do first” (e.g., prior authorization, coding) in order to ensure their patients receive the care they know they need. That same physician, however, emphasizes that “having to engage in a system that is contrary to what [they] want to do…that’s where the moral injury comes in.“ A psychiatrist similarly learned to “emphasize certain concerns to try to get coverage for the length of stay that [they] feel is truly necessary for the patient,” particularly when a health insurance company threatens to deny coverage of hospitalization. Even for these physicians, they worry this anticipatory obedience simply teaches the dominant financial actors pulling the strings in healthcare what frontline providers can put up with. They fear that soon they will be given even less time per patient than they are presently. Other physicians wish to speak honestly with patients , but dread being seen as the face of a broken healthcare system. Among our survey respondents, 22% often or always felt uncomfortable as the face of the organization for which they worked, and for 28% of respondents, being viewed as the face of their organization and having to legitimize the specific ways that their organization prioritized its margin over its mission provoked moderate or severe distress. A general internist worried about being viewed as “being on a team with the insurance company.” As a pulmonary/critical care physician disclosed, they desperately want to say, “this is not right,” and for patients to understand that they’re “on the same team against this nebulous system that’s conspiring to weaken the [patient-physician] relationship.” These coping responses often come to a head. As previously noted, one-quarter of practicing physicians we surveyed reported having left a position due to moral distress and a similar proportion are presently considering leaving a job due to moral distress.
For two-in-five of the practicing physicians who completed our survey, they often or always felt frustrated by their employers’ offering wellness activities that do not help them. A family medicine physician who we interviewed made it clear that physicians do not lack resilience and that “there’s no amount of yoga that will make [them] less distressed about how [their] patients are harmed, [their] staff is harmed, [they’re] harmed by this system.” They find the narratives around physician wellness and burnout lacking. Three-in-five of our survey respondents noted often or always having to deal with excessive documentation requirements that interfered with work-life balance; their employers’ desire to maximize charge capture by overemphasizing clinical documentation conflicted with intrainstitutional messaging around physicians’ wellbeing. The same family physician piquantly opined, “When we talk about burnout, it makes it sound like it’s my fault or my colleagues’ fault…The term points to the person being affected. [It’s] a form of victim shaming.” Physicians reducing their hours, leaving jobs, or leaving the profession are symptomatic of the moral distress clinicians contend with in their workplace.
As an emergency medicine doctor eloquently summarized, “If the canary is dying in the coal mine, you don’t talk about making a more resilient canary. You talk about changing the conditions that…are harmful and are dangerous.” Reframing what ails physicians and what harms patients as moral injury forces us to contend with the reality of a system that profits from individual patient’s suffering while preying upon clinicians’ compassion and service-mindedness.

Oregon Case Study
Executive Summary: Financialization in Health Care, Oregon Case Study, 2020–2025
Health Care Financialization in Oregon
While financialization is a phenomenon that has reached every corner of the nation, Oregon offers an instructive example of not only its consequences, but also the possibilities for resistance that exist through both state-level legislation and community action.
In recent years, the state of Oregon has experienced rampant financialization of healthcare systems, with several high-profile health care buyouts by large corporate entities (Hacker & Walker, 2023; PitchBook, 2024). In February of 2023, Amazon purchased OneMedical, a membership-based primary care chain of five clinics in Portland, for $3.9 billion, its third largest acquisition ever (Templeton, 2023). UnitedHealth Group, through its subsidiary Optum, has moved aggressively to purchase primary care practices, multi-specialty groups, independent practice associations, surgery centers, pharmacies, and post-acute providers in Oregon. Its recent acquisition of Corvallis Clinic drew vigorous opposition from the community, yet the deal was approved (Rogoway, 2024). In addition, Optum now owns Oregon Medical Group (OMG) in Eugene, GreenField Health and Family Medical Group Northeast in Portland, and multiple surgery centers and behavioral health clinics across the state (Optum Oregon, n.d.; PAI-Avalere, 2024). Immediate negative effects have been reported in the wake of these acquisitions. For example, 32 physicians immediately resigned from OMG, leaving patients suddenly without care and causing the practice to eliminate its obstetric and gynecological services entirely (Terry, 2025; Bondarenko, 2025).
Policy Context
During this period, Oregon has also demonstrated a viable path toward constraining these forces, while making progress toward broader, structural reform through legislative policies. The non-profit organization, Health Care for All Oregon (HCAO), has played a central role in this process by educating the public and legislators on universal health care, while also organizing action campaigns to press for policy reform.
Corporate Practice of Medicine (CPOM)
Legislation has banned corporations from majority ownership in medical facilities in Oregon since 1947. Over time, however, private entities discovered how to circumvent these restrictions through exploiting specific loopholes (Oregon State Legislature, 2025; Fahey et al., 2025). HCAO board member Hayden Rooke-Ley, a published scholar on the financialization of health care, worked closely with the bill’s chief sponsor, House Representative Ben Bowman, to draft and steward the bill through House committees and to a vote. HCAO educated advocates by positioning this work as a featured topic at its 2024 Annual Meeting and rallied Oregonians to submit testimony during legislative committee votes. In 2025, the Oregon legislature passed the strictest law in the nation closing these loopholes and banning the corporate ownership of medical entities (S.B. 951, 2025). As of Jan. 1, 2026, these restrictions immediately apply to all transactions occurring after the effective date of the bill, whereas deals completed prior to the effective date have a three-year adjustment period to come into compliance (McDermott Will & Emery, 2025; Hall Render, 2025).
Universal Health Care
A series of legislative efforts and advocacy campaigns have positioned Oregon to lead the nation in the pursuit of establishing universal health care on a state-level. HCAO’s education and advocacy work have been closely involved in each iterative step of the following legislative achievements.
- In 2019, the Oregon legislature passed SB770 creating the “Task Force on Universal Health Care” to research and ultimately recommend a universal health care system for Oregon. Their completed report in 2022 recommended a single-payer system (Joint Task Force on Universal Health Care, 2022).
- In 2022, ballot measure 111, which establishes health care as a fundamental right in Oregon’s state constitution, passed, albeit by the slimmest of margins (Ballotpedia, n.d.). Organized opposition was not a major factor in the lead up to the election, though some sources cited a fear of future lawsuits against the state and criticized the measure for not outlining a specific plan (League of Women Voters of Portland, 2022; Templeton, 2022). While the import of Measure 111 may have been unclear to some, establishing a constitutional right to health care created a mandate that legislators are now required to fulfill.
- The constitutional amendment led to the development and passage of Senate and House Bills 1089 and 2558, establishing the “Universal Health Plan Governance Board” (UHPGB). This Governor-appointed board’s sole task is to design a universal health care system for the state, including specific plans for benefits, financing, and implementation.
- The UHPGB convened in spring 2024 with a deadline of September 2026 to present its final proposal to the legislature (Oregon Senate Bill 1089, 2023; Universal Health Plan Governance Board, 2024).
Oregon Patient Focus Groups
The need for systemic policy reform is made evident by the growing literature capturing the harms of financialization in health care (Bruch et al., 2024; U.S. Department of Health and Human Services, 2025). To investigate these phenomena in Oregon, HCAO held two focus groups to explore patient experiences accessing health care: one in Eugene (in-person; n=9) and one statewide (online; n=10). A third focus group with Corvallis residents is scheduled for early February 2026. Eugene and Corvallis were chosen due to the local Optum acquisitions, while the statewide session sought more geographically diverse perspectives. Analysis of the data identified themes around quality, access, cost, and experience of care that directly point to the harmful impacts of financialization and for-profit elements in the health care system.
Decline in Quality of Care
Participants described highly negative experiences in their attempts to access quality care–e.g., appointments restricted to 20 minutes and a limited number of topics they were permitted to discuss. Participants in Eugene ascribed this to UnitedHealthcare’s acquisitions in the area, which subjects physicians to quotas for the number of patient visits per day. They also widely cited difficulties in establishing a long-term care provider due to restricted networks and lack of available doctors: “…You go through these networks that they tell you to find these doctors…but then you go in there, and you look up doctors, and you call them, and they’re like, ‘Oh, we’re not in network anymore.’ I mean, …I haven’t had a primary doctor in over 3 years. In over 3 years. So I just stopped going, because there’s no help, there’s no support.” Participants in Eugene directly attributed the worsening physician availability to Optum’s acquisition of OMG: “When Optum bought OMG, they lost 30% of their physicians, and they all left the area. So we now saw our 6-week wait time for a specialist go up to 11 months. Because suddenly, there’s no one here to do that care.” Participants also cited corporate practices like non-compete clauses, which were required as part of these acquisitions; physicians who chose not to work at OMG were barred from establishing new practices, exacerbating physician shortages.
Conflict between physician treatment regimens and insurance/administrative controls
Participants were acutely aware of the role that insurance and administration had on influencing, and limiting, their access to care. Patients cited open conversations with their doctors about the need to navigate insurance constraints. Many participants expressed sympathy for their physician’s position:
“And my own doctor has said, yeah, I’m gonna try really hard to get this for you, I don’t know if I can… I think the doctors really want to try. But I think some of them have gotten kind of burnt out and have just accepted that their hands are tied on things, and if they go against the grain, if they, say, work for United HealthCare or Samaritan, that they start to get pushed back on their own careers and their own practice, because they’re pushing too hard against what they know the rules are.” Many participants also recognized the burden on staff to complete the onerous paperwork needed to navigate insurance pre-authorizations and denials.
Impacts of profit-motive on delivery of care
The impact of insurance-required pre-approvals and denials were among the most prominent themes. Participants widely perceived them as a tool for profit-making: “…my experience with the pre-approvals… you know, I think the standard response is rejection or more hoops and red tape and everything. Because the more barriers there are, the less the insurance companies will have to pay out.”
Psychological toll of navigating financially driven health system
Participants simultaneously recognized the need to advocate for themselves and their family, while also describing it as an additional demand. The need to become experts in their health conditions and in the broader health system in order to fight for their needs exacts a heavy emotional burden on patients: “Then, the mental health part of it, you know, when you get depression and anxiety just thinking about trying to access healthcare, It shouldn’t be so awful… being overwhelmed by everything you’re gonna have to do to try to get the treatment…” Many participants were highly informed on mechanisms within the health system and how that has affected their care. Patients with complex health needs are forced to understand the structural reasons for the obstacles they face in the health system since the consequences of not understanding them are dire: “It’s baffling that so many of us here have…intensely complex needs. We should not know as much as we all know about how the healthcare industry works, and the only reason that we do is because we’re forced into it, because if you don’t, you will die.”
Future Outlook
While discussing solutions to improve the health care system, participants emphasized the importance of physician autonomy and controlling for-profit motives. Participants wanted“…doctors and our care team making decisions rather than health insurance.” They saw the goals of for-profit insurance as directly contradictory and harmful to a vision of care that is focused on patient experiences and needs: “…Insurance companies either need to get out of the game entirely or they need to completely not be privatized. Because as long as our healthcare is regulated by bodies that can make a profit from it, it’s not patient-centered. Period. Full stop, it’s not.”
Policy Implications and Recommendations
As Oregon evaluates a transition to universal health care, patient narratives provide critical evidence that the current system’s failures are structural, not individual. These experiences reveal how financialization has allowed profit motives to systematically undermine clinical care in terms of access, quality, and cost. By enforcing the new CPOM legislation and transitioning to a single-payer model, Oregon can directly eliminate the root causes of the barriers identified by patients in this study:
Implications of current CPOM legislation
- The elimination of non-compete clauses would expand physician availability, particularly in areas with private equity-acquired medical entities that previously barred ex-physicians from working in the region.
- The laws will help re-establish physician autonomy in clinical practice.
Implications of future universal health care legislation
- The current draft of Oregon’s single payer bill specifies no network restrictions; patients can access care with any doctor in the state.
- Healthcare-related financial burden on households will decline.
- Pre-authorizations and denials will decline dramatically, improving access to care and therefore health outcomes.
- Negative mental health impacts relating to navigating insurance barriers and that affect individual patients and clinicians will decline.
The evidence from these patient narratives confirms that the erosion of care is a direct byproduct of a financialized system that prioritizes profit margins over medicine. By implementing rigorous CPOM standards and advancing toward a universal health care model, Oregon is doing more than solving a local crisis; it is building a reproducible blueprint for state-level resistance and progress. Oregon’s path forward offers a scalable pilot for other states, or the nation, to reclaim health care as a public good and to further a vision of health care as a human right.
Study Limitations
This study contributes to the growing literature on physician moral injury, but several limitations warrant consideration. Although the survey’s sample is large, it may not be representative across geography, specialty, and practice setting, which may limit its external validity. The sample was not randomly selected; findings therefore reflect the experiences of physicians who self-selected to participate rather than the physician workforce as a whole. Additionally, certain physician populations, particularly those who have already exited clinical practice, may be underrepresented, potentially leading to an underestimation of the cumulative effects of moral injury on workforce attrition.
The mixed-methods design offers important strengths, including opportunities for data triangulation. While this report linked survey data with narrative responses, future studies could enhance integration by systematically pairing qualitative themes with corresponding quantitative indicators (e.g., stratifying narratives by distress levels or ethical conflict domains). Such approaches would allow qualitative data to more directly inform interpretation of survey findings and better capture the complexity of physicians’ ethical experiences.
Finally, because this study captures physician experiences at a single point in time, it cannot assess the development, escalation, or resolution of moral injury throughout a physician’s career. Longitudinal research is required to investigate causal pathways linking organizational and policy changes to physician moral injury, including the impact of payment structure changes on physician retention. Future investigations should also examine how moral injury varies across specialties, career stages, and practice environments, and evaluate which structural reforms effectively diminish moral injury rather than merely alleviating its symptoms. For instance, groups in which structural sources of moral injury may differ include medical students, residents, fellows, rural health practitioners, and reproductive health specialists. Additionally, although prior research on moral distress and injury has included other health professionals such as nurses, physical and respiratory therapists, and psychologists, limited work has evaluated the systemic sources of moral injury in these groups, and this evaluation is imperative.
Recommendations for Meaningful Change
Policy Recommendations
Our project employed narrative research methodologies to analyze the United States healthcare system through the lens of physician moral injury and to examine the influence of financialization on the system. The narratives of physicians and patients illustrate a crisis of access to evidence-based healthcare and the resulting moral injury among healthcare professionals.
These stories make clear that limited approaches targeting individual physician burnout are insufficient to address the deep-seated, systemwide challenges facing American healthcare, as physician moral distress and injury are systemic outcomes of a framework that prioritizes financial performance over clinical judgment and patient needs (Buchbinder et al., 2023). When prior authorization, profit-driven coverage decisions, and corporate ownership models consistently hinder physicians’ capacity to deliver appropriate care, moral distress should be understood not as a personal failing but as an inevitable consequence of the system.
Numerous meaningful concrete steps to control the negative impacts of corporatization of healthcare have been proposed and are reasonable to undertake. These include:
1) Medicaid Reforms
- Deprivatizing Medicaid – Returning Medicaid programs to state or non-profit management (PNHP, Removing the Middlemen from Medicaid, 2025)
- Automatic Enrollment/presumptive eligibility – Shifting to “opt-out” rather than “opt-in” enrollment for anyone eligible for zero-premium plans (such as those under 150% of the Federal Poverty Level)
- Eliminating work requirements
- Reforming Medicaid Pharmacy Benefit Managers (PBM), either to create a single statewide PBM, or simply to return to state-run FFS pharmacy benefit management within Medicaid
2) Regulating the privatized aspects of Medicare (Medicare Advantage)
- Implementing comprehensive Medicare Advantage reforms recommended by members of Congress
- Eliminating wasteful overpayments (PNHP, MA Overpayments Report, 2024)
- Strengthening enforcement against Medicare Advantage insurers that deny care (e.g., Senate Permanent Subcommittee on Investigations, 2023, “Examining Healthcare Denials and Delays in Medicare Advantage”)
- Longer-term, restructuring of Medicare to eliminate disparities that disproportionately affect people of color remains essential (PNHP, 2025, “No Real Choices–How Medicare Advantage Fails Seniors of Color”)
- Improving Traditional Medicare so that financial concerns and the need for Medigap coverage do not push people toward privatized Medicare; essentially “Leveling the Playing field” – specific approaches include instituting a strict out-of-pocket cap, expanding coverage to include vision, dental, and hearing services, and using public health programs to pilot low-cost, universal-access models similar to Traditional Medicare and the VA.
3) Addressing the abusive practices of private insurers
- Eliminating needless prior authorizations and denials of care
- Requiring insurers to publish clear data on claim denial rates, wait times, and the exact percentage of premiums spent on actual care versus overhead
4) Reforming/Enforcing corporate practice of medicine (CPOM) laws
- Modern enforcement must address the loopholes that insurers and private equity firms exploit through ironclad contracts to strip physician-owners of actual agency
- Comprehensive legislation should legally redefine “clinical control” to include any economic pressure—such as patient volume quotas, equipment selection, or staffing ratios—that dictates how medicine is practiced
5) Addressing the crisis of medical debt with debt abolition approaches. While not a substitute for systemic reform, medical debt abolition provides rapid relief while broader access reforms are pursued.
- By one estimate, medical debt affects 100 million Americans (Lopes et al., 2022) and amounts to $220 billion (Rakshit et al., 2024)
- Medical debt disproportionately affects Black and Hispanic households and reinforces existing racial and economic inequities. According to survey data, 27.9% of households with a Black householder carry medical debt, compared to 17.2% of households with a White non-Hispanic householder and 9.7% of households with an Asian householder. Households with a householder of Hispanic origin are also more likely to hold medical debt (21.7%) than households without a Hispanic householder (18.6%) (Bennet et al., 2021). These disparities show how cost-sharing and inadequate coverage translate illness into long-term financial instability, reinforcing existing racial and economic inequities and perpetuating structural racism within the health care system. Immediate harm-reduction strategies, such as state and local medical debt buyback and forgiveness programs, offer a proven, scalable intervention to relieve financial strain on households most affected by inequitable coverage and cost-sharing.
- Implementing and enforcing clear standards of community benefit for non-profit health systems that benefit from substantial tax breaks. This would include more rigorously proscribing the use of extraordinary debt collection measures, which trap individual patients and families in litigation and which adversely affect their access to credit to meet other social needs (e.g., housing).
6) Establishing algorithmic accountability for insurers, hospitals, and CMS so automated decision-making is transparent and systemic bias is minimized
7) Addressing care deserts by funding safety-net hospitals in medically underserved and rural areas
8) Reforms that empower the health care workforce are also necessary changes
- Aligning physician reimbursement with patient-centered care
- Reducing administrative burdens
- Supporting physician and trainee unionization
- Expanding residency training
The policy recommendations above are strategies for operating within a profit-driven system that inherently creates conflicts of interest, pitting physicians and patients against corporations and their shareholders.
Global Structural Reform
To meaningfully address the systemic causes of moral injury and prioritize optimal health outcomes through evidence-based, patient-centered care, we need to rethink healthcare delivery in the United States. Only a universal coverage system, grounded in science and clinical need—not ability to pay—will truly free physicians from making impossible choices about who receives care. Patients deserve a system that does not pit their health care needs against corporate profits.
This transformation can be achieved through implementing single-payer healthcare reform, where coverage is publicly funded, universal, and free at the point of service.
Under this model, every resident of the United States would receive coverage for all medically necessary services—including mental health care, rehabilitation, dental care, and medications—without deductibles, copayments, coinsurance, or prior authorizations. Single-payer reform would directly confront the harms perpetuated by health care financialization by ensuring that the focus remains on delivering quality, evidence-based, and trustworthy care to all patients.
In a single-payer system, the list of covered services, medications, and devices would be determined by panels of experts and patient advocates to ensure comprehensive and evidence-based coverage. Physician autonomy would be restored by eliminating insurance middlemen whose denials and prior authorizations are designed to maximize profits rather than optimize care.
Payments to doctors and hospitals would come from a single national insurer, with hospitals funded through global budgets rather than per-patient billing. This approach would eliminate incentives for upcoding, favorable selection or de-selection of patients, and other profit-driven practices. Removing financial motivations for patient selection based on socioeconomic status or insurance type promotes equity in care. Global budgeting also facilitates equitable distribution of healthcare services, as hospital construction would be guided by population needs rather than payer mix.
Universal access and centralized decision-making can help address some root causes of racism in healthcare; however, additional efforts are needed to design a truly anti-racist healthcare system. Decoupling healthcare access from employment and citizenship, and making residency the sole requirement for care, would ensure that migrant and precariously employed communities are not excluded by legal status.
Global budgets based on community health needs can also reduce healthcare deserts in underserved urban and rural areas. Uniform reimbursement rates would eliminate the two-tiered quality of care that penalizes providers in marginalized neighborhoods. Additionally, efforts to address long-standing systemic racism would include auditing biased clinical algorithms and publicly reporting health outcomes stratified by race and primary language.
A single-payer system would also promote reproductive justice by unlinking bodily autonomy from financial capacity and legal status. Eliminating all cost-sharing—including premiums, deductibles, and co-payments—would remove the financial pressures that influence reproductive choices. Access to comprehensive care such as contraception, abortion, fertility treatments, and prenatal support would be based on need rather than market price. This model would also address maternal mortality by providing lifelong coverage and by funding community-based interventions like doulas and midwives, which are essential for reducing disparities in marginalized communities. Framed within a broader public health approach that tackles social determinants like housing and environmental safety, this system would uphold the right to parent in healthy environments and foster reproductive and racial justice.
By eliminating financialization, a single-payer system would reduce barriers to care for patients, restore physician autonomy, reprioritize patients over profits, and ensure equitable access to health services for all.
Appendix
National Survey Findings
We invited self-administered responses to the online survey from January through September 2025. We received a total of 1,886 survey responses, of which 1,208 respondents were currently practicing (i.e., non-retired), board eligible/board certified physicians or physician residents or fellows (Table 1). Tables 2, 3, and 4 provide further information regarding the demographic, professional, and practice-setting characteristics of these 1,208 physician respondents.
Table 1. Profession of all respondents (n=1,886) to the PNHP Moral Injury Survey

Table 2. Demographic Characteristics of Practicing Physicians Who Responded to the Survey

1. Column totals for each category may not sum to 1,208 due to respondents choosing to not respond to a question.
2. Percentages for each category may not sum to 100% due to rounding.
Table 3. Professional Characteristics of Practicing Physicians Who Responded to the Survey

1. Column totals for each category may not sum to 1,208 due to respondents choosing to not respond to a question.
2. Percentages may not sum to 100% due to rounding.
Table 4. Practice Setting Characteristics for Practicing Physicians Who Responded to the Survey

1. Column totals for each category may not sum to 1,208 due to respondents choosing to not respond to a question.
2. Percentages may not sum to 100% due to rounding.
Physicians’ Self-rated Burnout and Proportion Previously or Currently Considering Leaving a Job due to Moral Distress
Of the 1,208 practicing physicians, the median and most common self-rated level of burnout was ‘moderate.’ Notably, 213 (18%) physicians appraised their level of burnout as ‘severe’ or ‘complete,’ whereas only 151 (13%) noted no burnout (Figure 1).

With regards to consideration to leave a position, 320 (27%) physicians had previously left a position due to moral distress and 518 (42%) had previously contemplated leaving a position due to moral distress but had decided not to leave the position (Figure 2).

One-quarter (306) of physician respondents reported currently considering quitting a job due to moral distress (Figure 3). Notably, 47% of physicians, residents, and fellows had previously considered leaving or left a position due to moral distress, and 11% were presently considering leaving a training post due to moral distress.

Leading Contributors to Moral Distress and Severity of Moral Distress
We had complete responses from 1,206 practicing physicians to all 22 questions (1 physician did not respond to questions 19-22 and 1 physician did not respond to questions 1-22) that sought to illuminate potential root causes of moral distress in clinical practice. As a reminder, these questions asked respondents to identify both the frequency and level of distress with which they experience these scenarios. Similarly to the method used to score the Measure of Moral Distress for Health Care Professionals (MMD-HP) instrument upon which we based our survey, the overall severity of moral distress is calculated as the sum of the individual frequency (0 [never] to 4 [always]) multiplied by the level of distress (0 [never] to 4 [very]) across the 22 questions.
Across the 22 questions, the median frequency with which physicians encountered the potentially morally distressing situations was 2 (“sometimes”), whereas the median level of distress was 3 (“moderate”). For 21 of 22 questions, the mean level of distress rating exceeded the mean frequency with which the scenario or sentiment was experienced. To wit, for 18 of 22 questions, the most common level of distress was noted to be “very distressing” (4 out of possible 4).
Table 5 lists the 22 questions in descending order of ranking based on the mean composite score (mean frequency multiplied by mean level of distress).
Table 5. Ranked Root Causes of Moral Distress

*Denotes questions included in the original Measure of Moral Distress for Health Care Professionals (MMD-HP) Instrument
Figure 4 presents the distribution of overall moral distress severity scores for the 1,206 practicing physicians who completed the survey and for whom we have complete responses.

Study Materials
Physician Focus Group Questions
A. 6:15 – 6:35 Physician Autonomy
To start off, we want you all to think about your professional autonomy in caring for patients; that is being able to provide your patients with the care you think is in their best interest reflecting on any external factors that might impact this.
- What factors do you think are most important when you make medical recommendations to a patient?
- Can you describe any times when the financial goals of your organization or of the patient’s insurer influenced your recommendations?
- What are thoughts and feelings on this?
- Do you think this impacts patient outcomes in positive or negative ways?
- How have you seen the Doctor/Patient Relationship change over the course of your career?
- How so? – Elaborate
- Have you ever experienced a conflict of interest while providing care to your patients? Please elaborate
B. 6:35 – 6:55 Financialization in Healthcare
For our discussion we will define financialization as the increasing influence of financial markets, institutions, and profit driven actors such as private equity on the healthcare system. This process may shift priorities of patient care, health outcomes, profit maximization and shareholder value.
- Does this conceptualization resonate in any way with any of you in regards to your ability to provide patient care?
- What does financialization mean in the context of healthcare?
- Do you see it in your practice? Can you provide examples ? With that understanding of the term “financialization,” can you give me an example from your clinical career of the impact of financialization on your ability to provide patient care?
- How do you see financialization affecting patient outcomes?
- How does it affect you?
C. 6:55 – 7:15 Impact on Populations Historically Impacted by Racism
For this discussion, we define structural racism as the systemic discrimination and inequities embedded within our healthcare system.
- “What do you think are the equity implications of financialization?
- In what ways does structural racism impact your ability to care for patients if at all?
- Follow up: Can you think of a specific situation(s) where this has occurred in your career?
- Follow up: How does this affect you personally and professionally?
- Do you see financialization in your practice affecting your ability to care for patients who may be impacted by racism?
- Follow up: In what ways?
- Follow up: How does this feel?
D. 7:15 – 7: 25 Moral Injury and Ethical Dilemmas
To close out our discussion, the last topic we would like to address is moral injury. We are defining Moral Injury in healthcare as the distress physicians have when they know what their patients need and they cannot provide it for them because of constraints outside of their control. I would like for you all to think back to the day you started medical school and consider how our healthcare system has changed during the course of your medical career.
- Ideally what are the feelings you would like to have about practicing medicine?
- Elaborate
- What words would you use? – Define them
- How would you describe your current feelings about the healthcare profession
- Elaborate on why you feel that way?
- Does the concept of moral injury resonate with you?
- Do you see a difference between “moral injury” and “burnout”?
- Can you share an example from your own clinical experience?
- Has professional dissatisfaction impacted your career path?
- Have you ever considered leaving your job?
- Retiring early?
- Leaving clinical practice?
National Survey
A. Demographics
1. Please choose the gender identity you most align with:
- Woman
- Man
- Non-binary / No gender
- Transgender
- Prefer not to say
2. Please choose the racial/ethnic background(s) you most align with:
- White/Caucasian
- Black or African American
- Asian
- American Indian or Alaska Native
- Latino or Hispanic
- Native Hawaiian or Pacific Islander
- Middle Eastern or North African
- Prefer not to say
- Other
3. Which profession do/did you align with?
- Physician
- Nurse
- Medical student
- Resident/Fellow
- Other healthcare professional
- Patient
- Healthcare advocate
- Other (ie. Veterans Affairs, etc)
4. What is your Medical Specialty? If you are a student, please type in “student.” How long have you been practicing medicine?
- Student
- Less than 3 years
- 3-5 years
- 6-10 years
- 11-20 years
- Over 20 years
- Retired
5. What type of institution(s) do you currently work /previously worked in? Please choose all that apply.
- Private hospital
- Public hospital
- Urgent care
- Public clinic
- Private practice
- Other (ie Veterans Affairs, etc)
6. Roughly what percentage of uninsured patients do you encounter?
- Less than 5%
- 6%-25%
- 26%-50%
- 51%-75%
- Over 75%
- Unknown
7. Roughly what percentage of your patients are from racially or ethnically marginalized groups?
- Less than 25%
- 26%-50%
- 51%-75%
- Over 75%
- Unknown
B. Moral distress occurs when professionals cannot carry out what they believe to be ethically appropriate actions because of constraints or barriers. This survey lists situations that occur in clinical practice. If you have experienced these situations, either currently or in the past, they may or may not have been morally distressing to you.
Please indicate how frequently you have experienced each item. Also, rank how distressing these situations are/were for you. If you have never experienced a particular situation, select “0” (never) for frequency. Even if you have not experienced a situation, please indicate how distressed you would be if it occurred in your practice. Note that you will respond to each item by checking the appropriate column for two dimensions: Frequency and Level of Distress.
Please answer the following questions based on your current and/or past experience:
- Be unable to provide optimal care due to inadequate time
- Be unable to provide optimal care due to pressures from administrators or insurers to reduce costs
- Be required to care for more patients than I can safely care for
- Feel the financial goals of my organization conflict with my goals of best patient care
- Feel unable to provide patients with best possible care
- Make recommendations to patients that I know they will not be able to pursue because of their financial constraints
- Make diagnostic or treatment recommendations to patients that I know they will not be able to pursue because of limitations of the healthcare system
- Feel unable to provide patients with services such as post-acute care or physical therapy because of lack of access/availability or insurance approval
- Feel constrained in my ability to talk with patients because of concerns about patient satisfaction scores
- Work within power hierarchies in teams, units, and my institution that compromise patient care
- Feel complicit in a healthcare system that perpetuates structural racism
- Work within a healthcare system that does not treat vulnerable or stigmatized patients with dignity and respect
- Feel required to overemphasize tasks and productivity or quality measures at the expense of patient care
- Experience compromised patient care due to lack of resources, equipment, or bed capacity
- Experience lack of administrative action or support for a problem that is compromising patient care
- Have excessive documentation requirements that compromise patient care
- Have excessive documentations requirements that interfere with work life balance
- Have excessive administrative burdens because of insurance prior authorizations and denials of care
- Feel uncomfortable as the face of the organization or system I work with
- Work within a system that prioritizes financial goals over best patient care
- Feel betrayed by a healthcare system that hinders my ability to provide good patient care
- Feel frustrated by wellness activities provided by my healthcare employer that don’t help me
C. Please describe any situations in which you have felt moral distress.
1. How would you rate your current level of burnout related to your work as a physician?
- No burnout
- Mild burnout
- Moderate burnout
- Severe burnout
- Complete burnout
- Not Applicable
2. Have you ever left or considered leaving a clinical position due to moral distress?
- No, I have never considered leaving or left a position.
- Yes, I considered leaving but did not leave.
- Yes, I left a position.
3. Are you considering leaving your position now due to moral distress?
- Yes
- No
- Not Applicable
Physician Interview Questions

Interviewed Physician Characteristics

Patient Focus Group Questions
General Perceptions
- How would you describe your overall experience with health care or health insurance in recent years?
- Is that different from how it has been in the past?
- What changes have you noticed in the way health care is delivered or managed over time? What stands out to you?
Insurance and Access
- Could you tell us about your experiences with insurance coverage?
- Denial of claims
- Network restrictions
- Unexpected bills?
- How do you think providers make decisions about a treatment plan for you? Tell us about that experience?
- Science
- Type of insurance coverage (covered medications, procedures, specialists)
- Costs
- Which of these factors have affected your health care?
- Have you ever been confused or frustrated by billing, insurance coverage, or payment systems? What happened?
Quality of Care
- In your opinion, has the quality of care you receive improved, declined, or stayed the same in recent years? What makes you feel that way?
- How do you feel about the time that your provider spends with you during appointments
- What are some of the factors that are influencing the amount of time that your provider spends with you during your visits?
- How do you feel about the quality of those visits?
Trust and Transparency
- To what extent do you think health care institutions prioritize your well-being over profits?
- How much information do you receive about costs of procedures and medications from your health insurance?
Interactions with Providers and Institutions
- Have you had a health care experience when you felt like you were treated unfairly? Why do you think that happened? What would you say were the reasons?
- Race
- Ethnicity
- Gender
- Appearance
- Type of health insurance?
- By whom? Front desk staff, healthcare provider?
- To what extent does the current health care system reflect the values or needs of your culture or community? Why or why not?
Future Outlook
- Would it look like for health care to truly center patients and communities, rather than profits?
Quotes
The following quotes offer additional perspectives from physicians on their experiences within the healthcare system. These quotes have been transcribed from our Zoom-recorded physician interviews:
2a) I think I almost feel like this sense of like complicity in like taking part in the system that I, it doesn’t feel very patient, centered right and like rather than you know, pushing back and saying, like. you know, I can’t see this many patients, or I need to have, like ample time to, you know. for specific situations. I feel like I’m becoming like the face of like this healthcare system that’s not providing adequate time to these patients, you know, and I feel like there is. But am I like complicit in this by participating in this and like helping support that kind of system. And you know, on the days that I do get through every patient in 20 min like, is that just signaling to them that like, “hey? 20 min is enough time. They can go down to 15”. And so I’m there’s this kind of like lingering sense of almost like guilt, like I cause. I also have the sense of. I’m not providing, like the best care that I could. If I just had more time with each person. (Pulm Crit Care)
2b) Yeah, it kind of started when I was in med school, where people started kind of talking about it, and then residency and then fellowship. And then I get you know, it’s like, oh, yeah, that’s a thing. And it’s like, oh, yeah, I you know. if I’m working a hundred hours a week. I’m real burned out. I don’t care about anything, ever, anyone. I’m just in survival mode, right like. And it, you know. Wellness stuff doesn’t help. There’s no wellness to, you know, actual misery. And so I have to change my entire lifestyle. And there’s only so much you can change in the system right. (Pathologist)
2c) My organization has, does not place value on me as a human employee or the relationships that I build with my patients is really, really dispiriting. And that’s why I left that position. (FamMed)
2d) But I realized, too, that one of the reasons that it’s hard to quit is that I really love my patients. and you know most of them. But almost all of them. And so giving up the practice is like giving up those relationships. It’s not giving up work. And so I’m hoping that the segue here at this, if this peer support organization will give me a segue to ease out because I know, I know there. There are certain factors of aging that I just know I’m not going to be able to do it forever, and I’ll be 78 in April, and I got a plan for that. But it’s been a successful time. But it’s also, you know, now we’re looking at all the things that we worked for being dismantled at, especially at the national level. And I’m lucky I live in California, but that’s all. And you know the things that we thought we were building for future generations are just being dismantled right and left, like the research I did when I was at Stanford. I’ve done some research up here to have the research establishment going to have the just, the you know. We fought so hard for diversity in medicine, and you know, and that’s being dismantled. And this generally, the respect for doctors is going nowhere, and also, and not surprisingly. Then, whereas it was a move up for us to go into medicine for kids nowadays who want to take a step up in terms of status. It’s finance or tech. They don’t go into science. We’ve tried really hard to work this in another. (Surgeon)
2e) I fairly quickly kind of lost. I mean, maybe the best term is lost faith in that kind of medicine, because you know I was in an inner city clinic, and we had a lot of complicated patients and a lot of people with low resources, low socioeconomic status, and it just felt like we were admitting the same people for the same things that we were on this hamster wheel of admitting people for the COPD exacerbation or a heart failure, exacerbation, and then we’d admit them the next month. And so I felt like my passion lay more in the outpatient side of things, because if those same patients just had more support, had more resources, had better follow up, maybe things could turn out differently. And so that’s kind of how I arrived, doing what I do now. (FamMed)
2f) Oh, no! So I came into a pretty toxic world, and it’s only gotten worse, I mean much, much worse. I would never encourage any family member to go into medicine, although I have a few who are it, you know. And, and I say to any young person at this point, if you’re interested, you have to love it, don’t do it for any other reason, because it’s not worth it otherwise. So how has it gotten worse? I think that the financial incentive has taken an even stronger role. It’s just much more important. And the care that people are giving is really not prioritized at all to the point where, you know, medications people should be on. You can’t get access to it. That was always the case. It feels worse now. So as new meds come out again. My patients were Medicaid patients. They never had access to new meds. (Int.PubHealth. Prev)
2g) So there’s a part of it where you feel terrible that you’re not giving the patient what they need. You also feel terrible that overall as a society, you’re spending a lot more money than you should be, but you can see that there’s a more efficient and more cost-effective way of doing things, and you’re not doing it, so that would feel terrible. And then, on a personal level. The loss of physician autonomy is a, is a big issue as well, like I do not want to be told that I have to put in a discharge order. If I don’t feel like the patient is ready to be discharged, I think that, like prerogative, should stay with the physician and not with a hospital administrator. (Int Med)
2h) …influenced by insurance demands on my patient, you know, like, I’d rather just make the decisions based on the medical care I’m providing. And the patient in front of me.(Fam Med)
2i) …meeting those markers, or following the kind of recommendations that someone has set out for you, whether that’s the clinic management, or the administration of the system, or those, you know, CMS expectations sometimes seems to be in conflict with addressing the needs or concerns that are more immediate for an individual. (Fam Med)
2j) …patients are not the, the center, and they don’t even at this point lie about it. It’s no, no, it’s all about the chart. It’s all about the codes. I didn’t realize I became an ICD-technologist. But apparently I’m that, and I’m a cpt-ologist and an ENM-Codeologist in the military. We never used any of those. Suddenly I had to be an expert on all of that, and it was just like, that’s not what I got into medicine for, to learn all this nonsense. Somebody else do this like, let me do the diagnosing and treating and meeting people. (Fam Med)
2k) And so I’m there’s this kind of like lingering sense of almost like guilt, like I cause. I also have the sense of. I’m not providing, like the best care that I could. If I just had more time with each person. (Pulm Care/Crit care)
2l) I just, I feel like I know I’m not providing the best care that I could. It’s really frustrating to know that like people are, are dying of things that are treatable. It’s disappointing, because I know that I’m not practicing medicine like the way that I thought I would, or the way that I want to be practicing medicine, but it’s still better than you know not doing it. (Pulm Care/Crit care)
References
American Medical Association. (2016). AMA principles of medical ethics (Principles I, II, III, V, VI, VIII, & IX). American Medical Association. E-11.2.3 11.2.3 Contracts to Deliver Health Care | AMA. https://code-medical-ethics.ama-assn.org/sites/amacoedb/files/2025-12/11.2.3_1.pdf
Bailey, Z. D., Krieger, N., Agénor, M., Graves, J., Linos, N., & Bassett, M. T. (2017). Structural racism and health inequities in the USA: Evidence and interventions. The Lancet, 389(10077), 1453–1463. https://doi.org/10.1016/S0140-6736(17)30569-X
Bennett, N., Eggleston, J., Mykyta, L., & Sullivan, B. (2021, April 7). 19% of U.S. households could not afford to pay for medical care right away. U.S. Census Bureau. https://www.census.gov/library/stories/2021/04/who-had-medical-debt-in-united-states.html
Borsa, A., et al. (2023). Evaluating trends in private equity ownership and impacts on health outcomes, costs, and quality: Systematic review. BMJ, 382, e075244. https://doi.org/10.1136/bmj-2023-075244
Bruch, J. D., Roy, V., & Grogan, C. M. (2024). The financialization of health in the United States. New England Journal of Medicine, 390(2), 178–182. https://doi.org/10.1056/NEJMp2311161
Buchbinder, M., Browne, A., Berlinger, N., Jenkins, T., & Buchbinder, L. (2023). Moral stress and moral distress: Confronting challenges in healthcare systems under pressure. The American Journal of Bioethics, 24(12), 8–22. https://doi.org/10.1080/15265161.2023.2224270
Buchbinder, M., et al. (2024). Moral stress and moral distress: Confronting challenges in healthcare systems under pressure. The American Journal of Bioethics, 24(12), 8–22. https://pubmed.ncbi.nlm.nih.gov/37347222
Burden, M., Astik, G., Auerbach, A. D., Bowling, G., Kangelaris, K. N., Keniston, A., Kochar, A., Leykum, L. K., Linker, A. S., Sakumoto, M., Rogers, K., Schwatka, N., & Westergaard, S. (2024). Identifying and measuring administrative harms experienced by hospitalists and administrative leaders. JAMA Internal Medicine, 184(9), 1014–1023. https://doi.org/10.1001/jamainternmed.2024.1890
Dean, W., et al. (2024). Moral injury and the global health workforce crisis. New England Journal of Medicine, 391(9), 783–784. https://doi.org/10.1056/NEJMp2404906
Dzeng, E., & Wachter, R. M. (2019). Ethics in conflict: Moral distress as a root cause of burnout. Journal of General Internal Medicine, 35(2), 409–411. https://doi.org/10.1007/s11606-019-05505-6
Epstein, E. G., Whitehead, P. B., Prompahakul, C., Thacker, L. R., & Hamric, A. B. (2019). Enhancing understanding of moral distress: The Measure of Moral Distress for Health Care Professionals (MMD-HP). AJOB Empirical Bioethics, 10(2), 113–124. https://doi.org/10.1080/23294515.2019.1586008
Fuse Brown, E. C., & Hall, M. A. (2024). Private equity and the corporatization of health care. Stanford Law Review, 76(3), 527–596. https://review.law.stanford.edu/wp-content/uploads/sites/3/2024/03/Fuse-Brown-Hall-76-Stan.-L.-Rev.-527.pdf
Henry, T. A. (2022, January 18). Medicine’s great resignation? 1 in 5 doctors plan exit in 2 years. American Medical Association. https://www.ama-assn.org/practice-management/physician-health/medicine-s-great-resignation-1-5-doctors-plan-exit-2-years
Hines, S. E., Chin, K. H., Glick, D. R., & Wickwire, E. M. (2021). Trends in moral injury, distress, and resilience factors among healthcare workers at the beginning of the COVID-19 pandemic. International Journal of Environmental Research and Public Health, 18(2), 488. https://doi.org/10.3390/ijerph18020488
Institute of Medicine. (2002). Unequal treatment: Confronting racial and ethnic disparities in health care. National Academies Press. https://pmc.ncbi.nlm.nih.gov/articles/PMC2594273
Johnson, D. Y. (2024). Private equity in healthcare: An ethical perspective. FASPE Medical Fellows Publication. https://www.faspe-ethics.org/2024-journal-daniel-johnson
Kannan, S., Bruch, J. D., & Song, Z. (2023). Changes in hospital adverse events and patient outcomes associated with private equity acquisition. JAMA, 330(24), 2365–2375. https://doi.org/10.1001/jama.2023.23254
Lopes, L., Kearney, A., Montero, A., Hamel, L., & Brodie, M. (2022, June 16). Health care debt in the U.S.: The broad consequences of medical and dental bills. KFF. Health Care Debt In The U.S.: The Broad Consequences Of Medical And Dental Bills | KFF. https://www.kff.org/health-costs/kff-health-care-debt-survey
Maguen, S., & Griffin, B. J. (2022). Moral injury among healthcare workers. Frontiers in Psychiatry, 13, 874729. https://doi.org/10.3389/fpsyt.2022.874729
Maguen, S., & Griffin, B. J. (2022). Research gaps and recommendations to guide research on assessment, prevention, and treatment of moral injury among healthcare workers. Frontiers in Psychiatry, 13, 874729. https://doi.org/10.3389/fpsyt.2022.874729
Maslach, C., & Jackson, S. E. (1981). The measurement of experienced burnout. Journal of Organizational Behavior, 2, 99–113. https://doi.org/10.1002/job.4030020205
Medical Professionalism Project. (2002). Medical professionalism in the new millennium: A physicians’ charter. The Lancet, 359(9305), 520–522. https://doi.org/10.1016/S0140-6736(02)07684-5
Mewborn, E. K., Fingerhood, M. L., Johanson, L., & Hughes, V. (2023). Examining moral injury in clinical practice: A narrative literature review. Nursing Ethics, 30(7–8), 960–974. https://doi.org/10.1177/09697330231164762
Physicians for a National Health Program. (2025). Removing the Middlemen from Medicaid: A blueprint for better care and lower costs (Final report). https://pnhp.org/system/assets/uploads/2025/08/MedicaidBlueprintFinal.pdf
Physicians for a National Health Program. (2025). No real choices: How Medicare Advantage fails seniors of color (Final report). https://pnhp.org/system/assets/uploads/2025/10/MAEquityReport2025_Final.pdf
Physicians for a National Health Program. (2024). Our payments, their profits: Quantifying overpayments in the Medicare Advantage program (Final report). https://pnhp.org/system/assets/uploads/2024/11/MAOverpaymentsReportFinal.pdf
Rakshit, S., Rae, M., Claxton, G., Amin, K., & Cox, C. (2024, February 12). The burden of medical debt in the United States. KFF. The burden of medical debt in the United States – Peterson – KFF Health System Tracker. https://www.kff.org/health-costs/the-burden-of-medical-debt-in-the-united-states
Riedel, P.-L., Kreh, A., Kulcar, V., Lieber, A., & Juen, B. (2022). A scoping review of moral stressors, moral distress and moral injury in healthcare workers during COVID-19. International Journal of Environmental Research and Public Health, 19(3), 1666. https://doi.org/10.3390/ijerph19031666
Shay, J. (1995). Achilles in Vietnam: Combat trauma and the undoing of character. Scribner.
Stavroulaki, T. (2025). How private equity hurts the healthcare workforce. ProMarket, Stigler Center. https://www.promarket.org/2025/05/22/how-private-equity-hurts-the-healthcare-workforce
Talbot, S. G., & Dean, W. (2018, July 26). Physicians aren’t “burning out.” They’re suffering from moral injury. STAT. https://omahamedical.com/wp-content/uploads/2019/05/MD-burnout-as-moral-injury.pdf
Thibodeau, P. S., et al. (2023). The association of moral injury and healthcare clinicians’ wellbeing: A systematic review. International Journal of Environmental Research and Public Health, 20(13), 6300. https://doi.org/10.3390/ijerph20136300
Zhu, J. M., et al. (2024). Physician perspectives on private equity investment in health care. JAMA Internal Medicine, 184(5), 579–580. https://doi.org/10.1001/jamainternmed.2024.0123
Oregon Case Study References
Ballotpedia. (n.d.). Oregon Measure 111, Right to Healthcare Amendment (2022). https://ballotpedia.org/Oregon_Measure_111,_Right_to_Healthcare_Amendment_(2022)
Bondarenko, I. (2025, August 13). Optum-owned Oregon Medical Group is ending Eugene-area obstetric services. The Lund Report. https://www.thelundreport.org/content/optum-owned-oregon-medical-group-ending-eugene-area-obstetric-services
Bruch, J. D., Roy, V., & Grogan, C. M. (2024). The financialization of health in the United States. New England Journal of Medicine, 390(2), 178–182. https://doi.org/10.1056/NEJMms2308188
Fahey, D. L., Murphy, T. J., Neiman, E. J., & Peters, S. C. (2025, June 4). Oregon SB 951, regulating the corporate practice of medicine, awaits Governor’s signature. Epstein Becker Green: Health Law Advisor. https://www.healthlawadvisor.com/oregon-sb-951-regulating-the-corporate-practice-of-medicine-awaits-governors-signature
Fuse Brown, E. C., & Hall, M. A. (2024, March). Private equity and the corporatization of health care. Journal of Health Care Law & Policy. https://review.law.stanford.edu/wp-content/uploads/sites/3/2024/03/Fuse-Brown-Hall-76-Stan.-L.-Rev.-527.pdf
Hacker, J., & Walker, F. (2023, April 5). Opinion: Oregon should battle hostile takeover of its health care system. The Lund Report. https://www.thelundreport.org/content/opinion-oregon-should-battle-hostile-takeover-its-health-care-system
Hall Render. (2025, July 1). Oregon targets private equity-backed management services organizations through expansive corporate practice of medicine bill. https://hallrender.com/2025/07/01/oregon-targets-private-equity-backed-management-services-organizations-through-expansive-corporate-practice-of-medicine-bill
Joint Task Force on Universal Health Care. (2022). Final report and recommendations. Oregon Health Authority. https://www.oregon.gov/oha/HPA/HP/TFUHC%20Meeting%20Documents/Joint%20Task%20Force%20on%20Universal%20Health%20Care%20Final%20Report%20%20Recommendations%20Oct%202022.pdf
League of Women Voters of Portland. (2022). Ballot measure 111: Right to health care amendment. https://lwvpdx.org/wp-content/uploads/2022/10/Measure-111-Health-Care-Edited-Final-Layout.pdf
McDermott Will & Emery. (2025, June 12). Oregon enacts expansive corporate practice of medicine bill. https://www.mwe.com/insights/oregon-enacts-expansive-corporate-practice-of-medicine-bill
Optum Oregon. (n.d.). Family Medical Group Northeast: Part of Optum. https://optumor.com/fmg
Oregon Senate Bill 1089, 82nd Oregon Legislative Assembly (2023). https://olis.oregonlegislature.gov/liz/2023R1/Downloads/MeasureDocument/SB1089
Oregon Senate Bill 951, 83rd Oregon Legislative Assembly (2025). https://olis.oregonlegislature.gov
Oregon State Legislature. (2025, January 26). What is the corporate practice of medicine (CPOM) doctrine? [Floor Letter from Senator Deb Patterson]. Oregon Legislative Information System. https://olis.oregonlegislature.gov/liz/2025R1/Downloads/FloorLetter/4296
Physicians Advocacy Institute. (2024, April). PAI-Avalere report: Physician employment and practice ownership trends (2019–2023). https://www.physiciansadvocacyinstitute.org/PAI-Research/PAI-Avalere-Study-on-Physician-Employment-Practice-Ownership-Trends-2019-2023
PitchBook. (2024). One Medical company profile. https://pitchbook.com/profiles/company/450331-39#overview
Rogoway, M. (2024, March 14). Oregon health officials give emergency OK to Corvallis Clinic’s acquisition by insurance giant UnitedHealth Group. The Oregonian. https://www.oregonlive.com/business/2024/03/oregon-health-officials-give-emergency-ok-to-Corvallis-clinics-acquisition-by-insurance-giant-unitedhealth-group.html
Subbiah, P., & Scheffler, R. M. (2025, May). When does private equity ownership of physician practices violate “first, do no harm?” Health Affairs. https://journalofethics.ama-assn.org/article/when-does-private-equity-ownership-physician-practices-violate-first-do-no-harm/2025-05
Templeton, A. (2022, November 15). Measure 111 passes, giving Oregonians a constitutional right to access affordable health care. Oregon Public Broadcasting. https://www.opb.org/article/2022/11/15/oregon-election-right-to-affordable-health-care
Templeton, A. (2023, February 23). Oregon OKs Amazon plan to buy chain of medical clinics. The Lund Report. https://www.thelundreport.org/content/oregon-oks-amazon-plan-buy-chain-medical-clinics
Terry, L. (2025, October 6). OB-GYNs quit Oregon Medical Group, affecting birth plans for some expecting moms in Eugene-Springfield area. KLCC. https://www.klcc.org/health-medicine/2025-10-06/ob-gyns-quit-oregon-medical-group-affecting-birth-plans-for-some-expecting-moms-in-eugene-springfield-area
Universal Health Plan Governance Board. (2024). UHPGB July 2024-September 2026 work plan. Oregon Department of Consumer and Business Services. https://www.oregon.gov/uhpgb/about/pages/about.aspx
U.S. Department of Health and Human Services. (2025). Consolidation in health care markets RFI response report. https://www.hhs.gov/sites/default/files/hhs-consolidation-health-care-markets-rfi-response-report.pdf
Acknowledgements
Principal Investigator: Diljeet K. Singh, MD, DrPH
Lead Study Coordinator: Rebecca Delay, MPP
Leading Researchers: Carol Paris, MD; Anand R. Habib, MD, MPhil, MHS
Supporting Staff: Anika Thota, BA
Consulting Senior Researcher: Dharma E, Cortés, PhD
Additional Authors: Donald Bourne, PhD, MPH; Toby Terwilliger, MD; Rebecca Schoon, PhD
Support: Monica Maalouf, MD; Ashley Duhon, MD; Lisset Dumet, PhD; Audrey Fleming, Undergraduate
Advisory Committee: Camara Jones, MD, Ph.D, MPH; Linda Rae Murray, MD, MPH; Hayden Rooke-Ley, JD; Chiamaka Okonkwo, MPH; Priya Patel, Medical Student
Working Group Members: Cassie Craig, Medical Student; Evan Hawthorn, Medical Student; Corinne Forguni, MD; Marie Hobart, MD
Support for this research was provided by the Robert Wood Johnson Foundation. The views expressed here do not necessarily reflect the views of the Foundation.


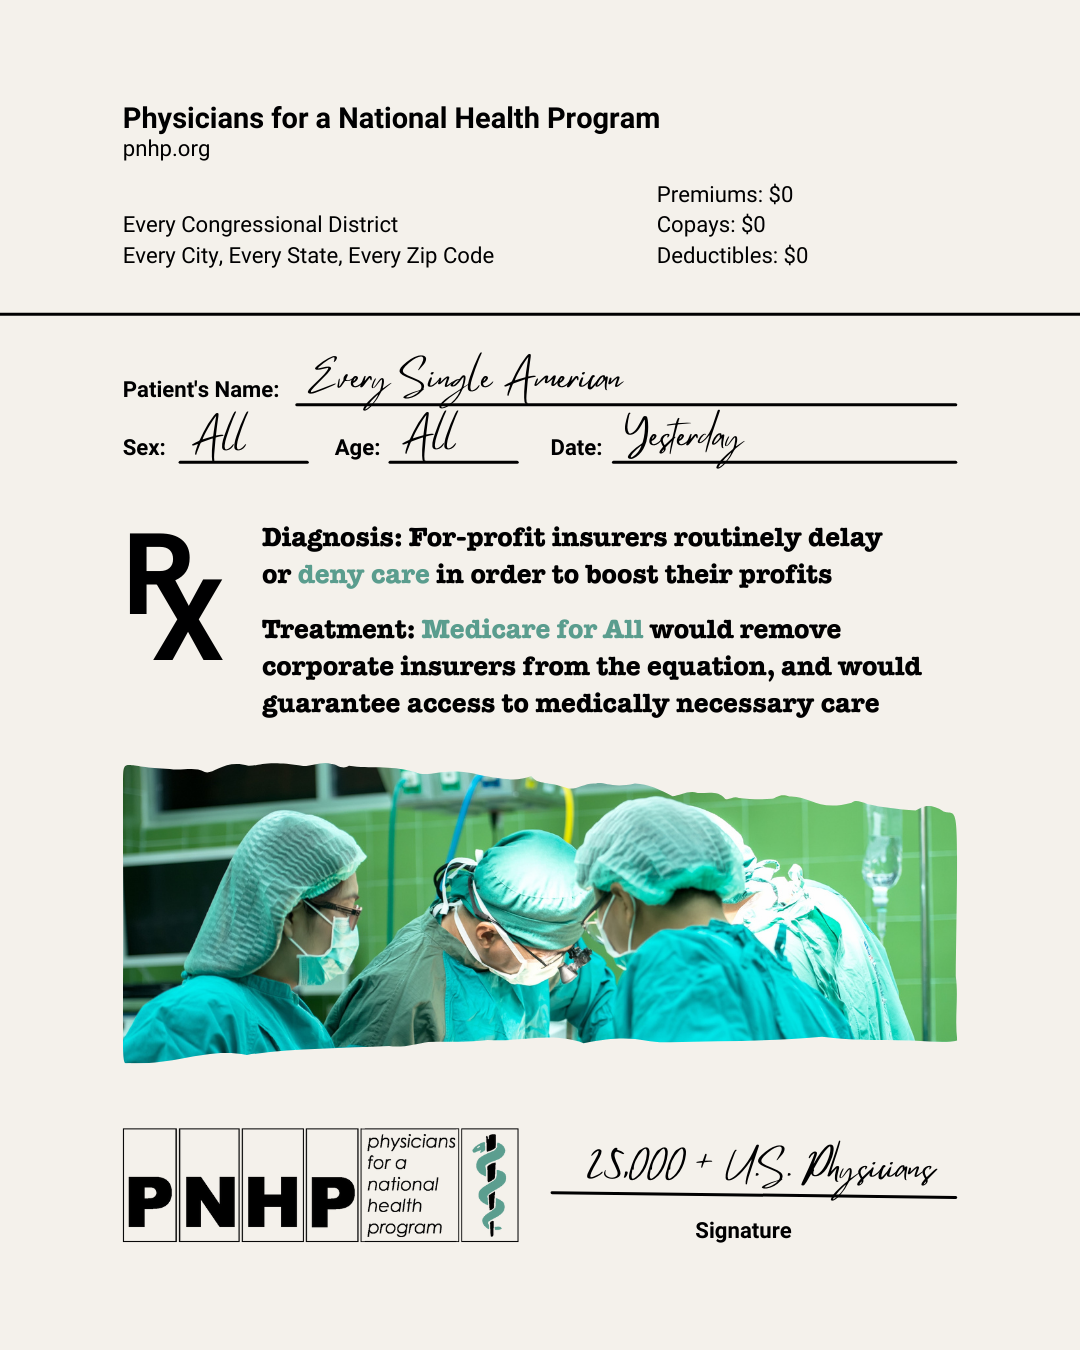
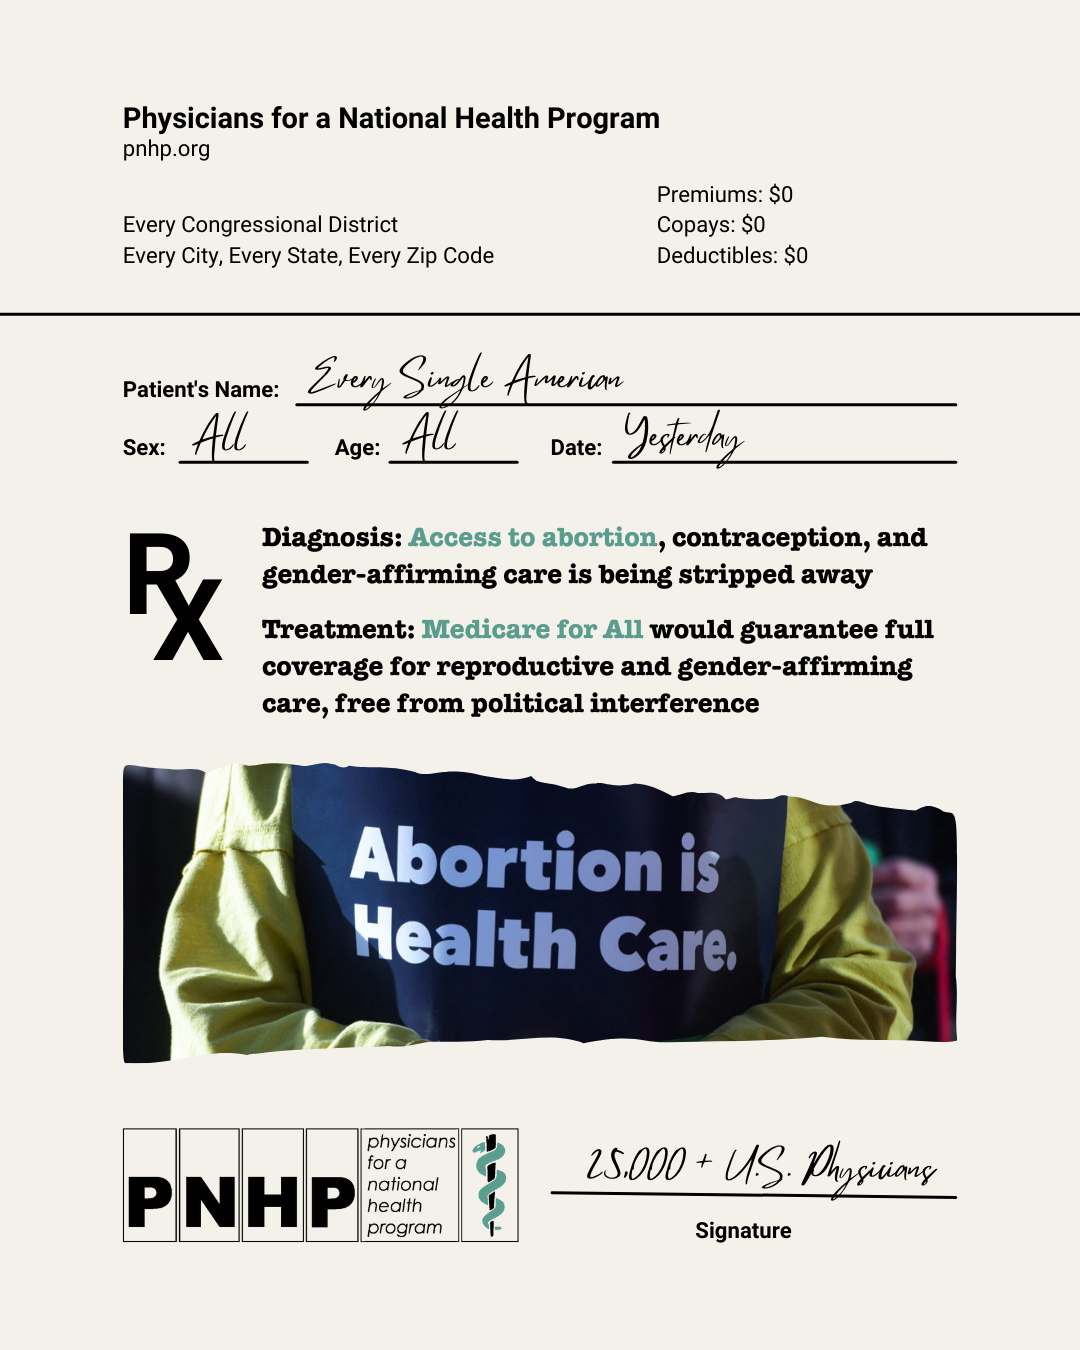

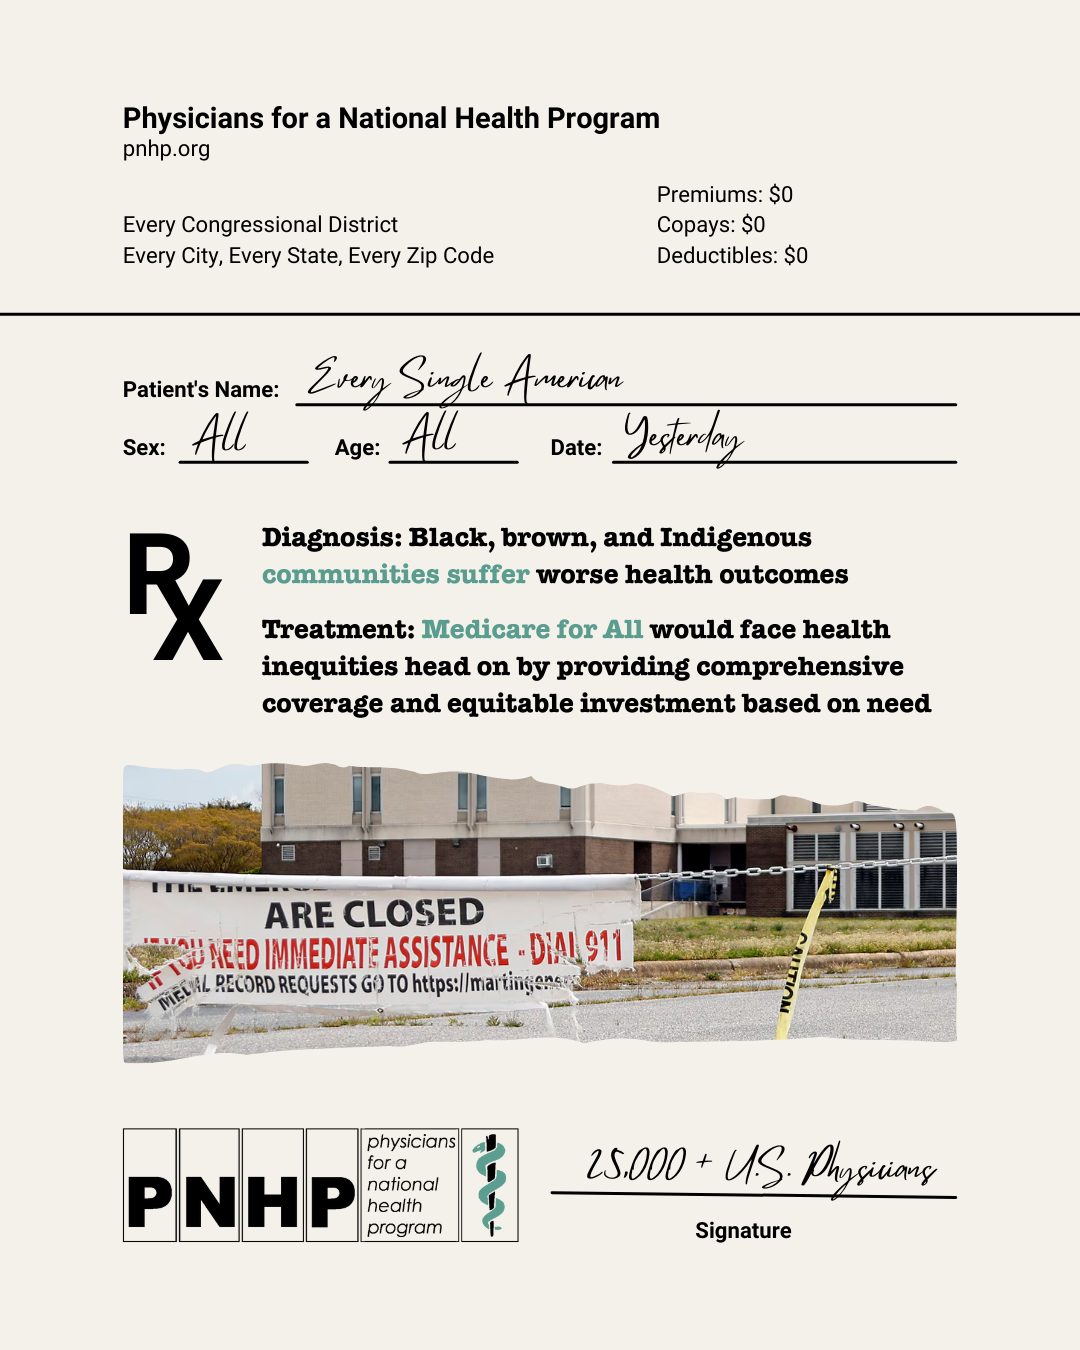
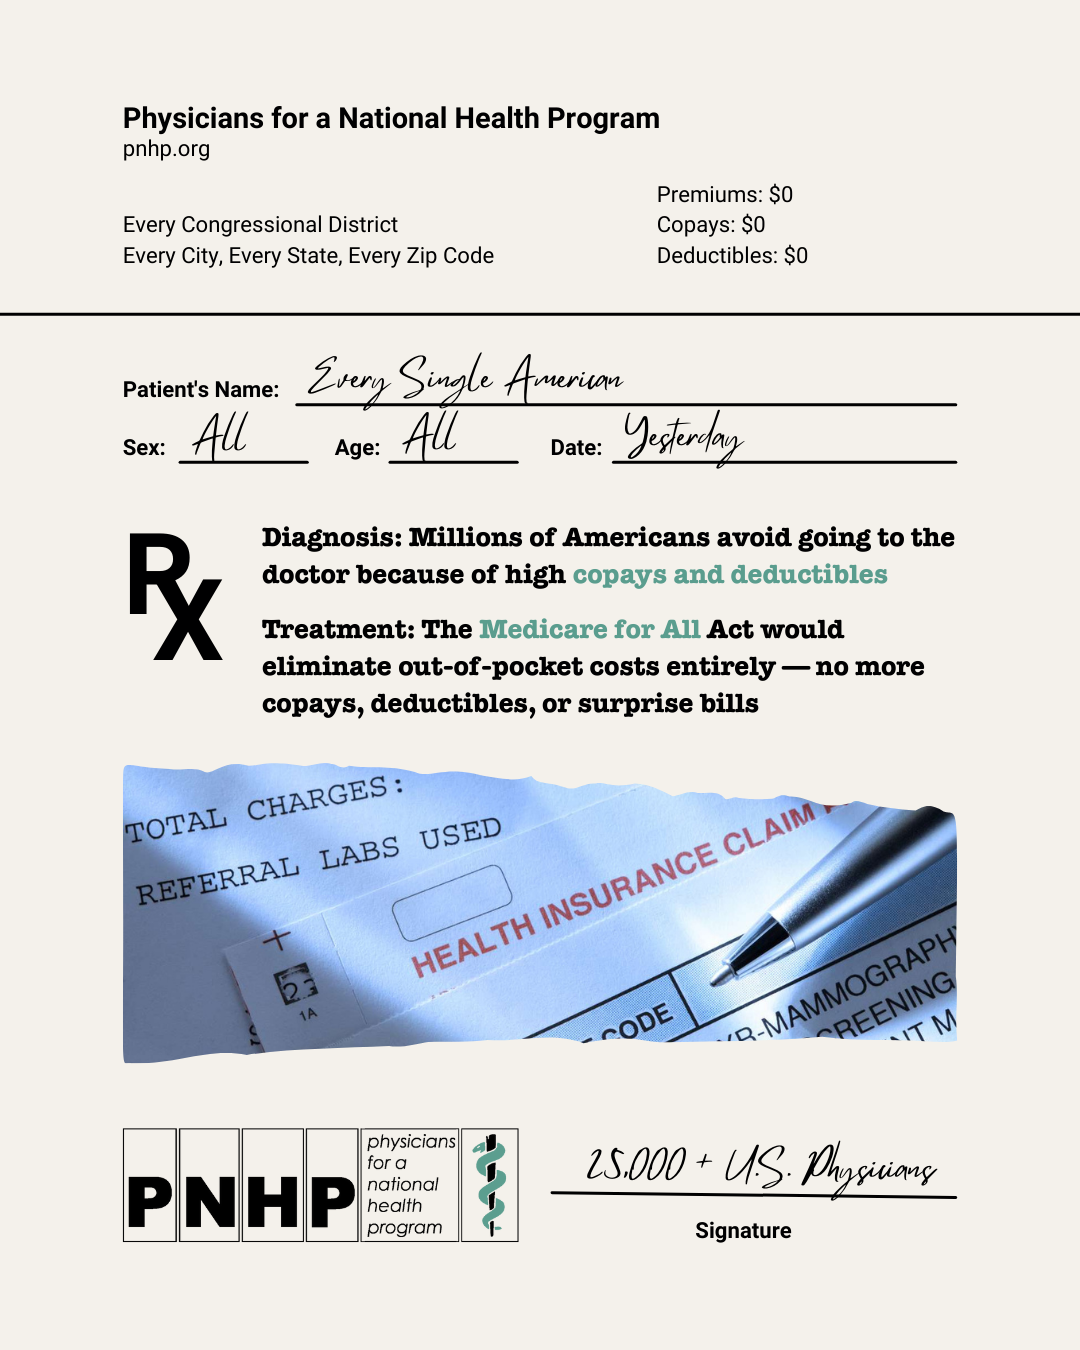
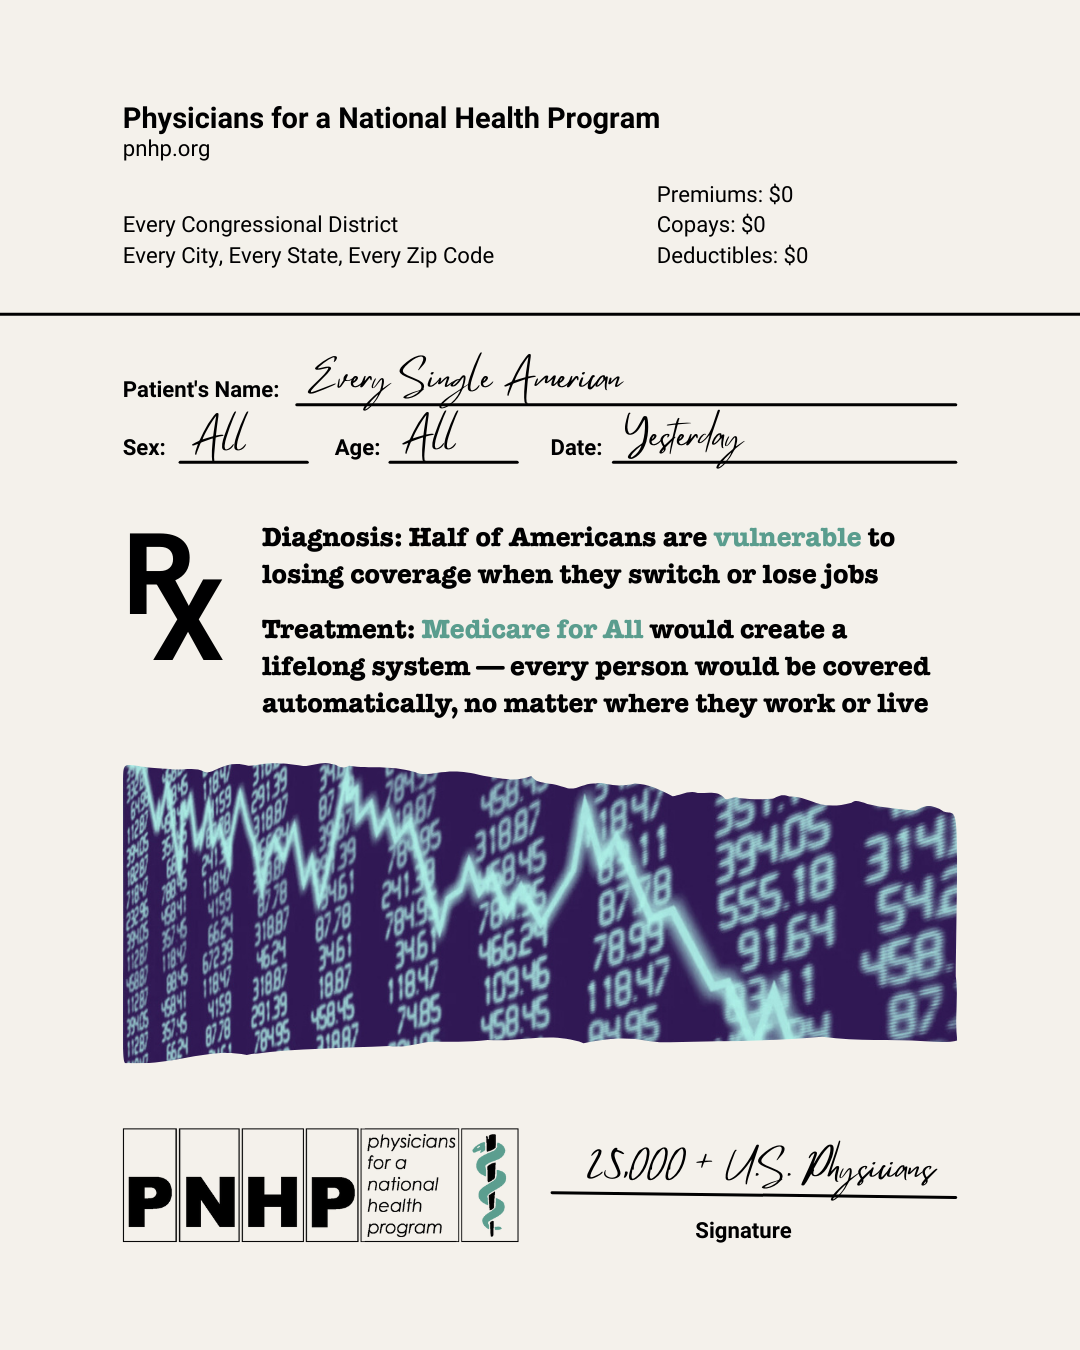


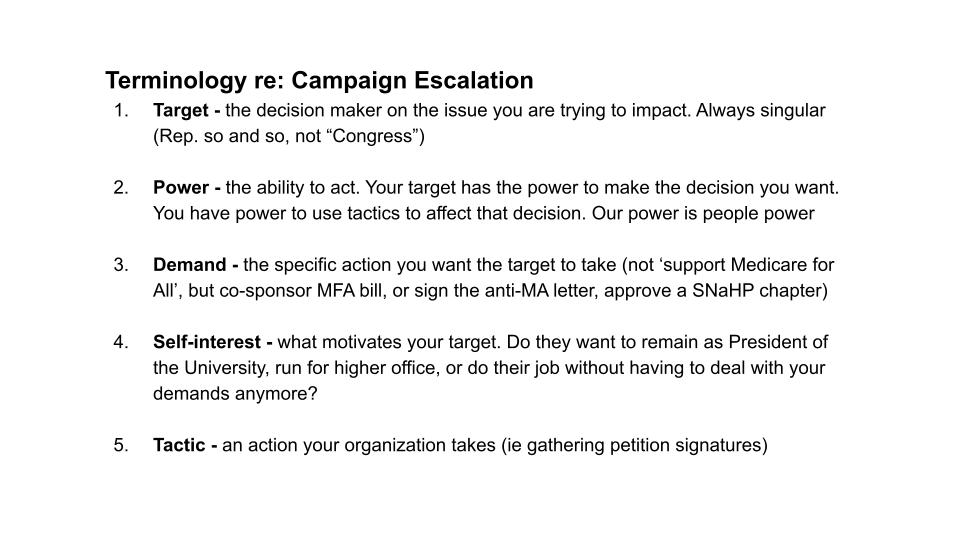