By John McDonough
Boston Globe, August 14, 2013
Fine story in today’s Globe by Liz Kowalczyk on the new state health data report showing, once again, the dominant economic power of Partners Healthcare in our health market. One beef — if you read you the story, you would have assumed that the annual report from the State’s Center for Health Information and Analysis (CHIA) was all about Partners. There is much more — go see for yourself. and congrats to CHIA for an excellent report.
Here’s what struck me the most:

From the report:
“In a continuing trend, the health coverage available through Massachusetts employers in 2011 cost more and had lower benefit value. Between 2009 and 2011 premiums rose by 9.7% to pay for benefits that decreased by 5%. Consistent with this trend, employees are paying increasingly more out-of-pocket for their health care. Deductibles have grown in Massachusetts by more than 40% between 2009 and 2011, approaching the national average.”
Massachusetts has always been one of the most resistant states to high levels of patient cost sharing in the form of deductibles, co-pays, and coinsurance. If these new data are on the mark, no more. We’re just average — and a 40% uptick over three years! Ouch!! On average, with premiums up 9.7% and benefits down by 5%, that’s a 14.7% drop in value for consumers between 2009 and 2011, reinforcing the point, it’s not just about the premiums, even if that’s what gets all the attention.
Yes, Partners is big: see this pie chart for the evidence. And their 31% in 2012 share is rising, up from 28% in 2011:
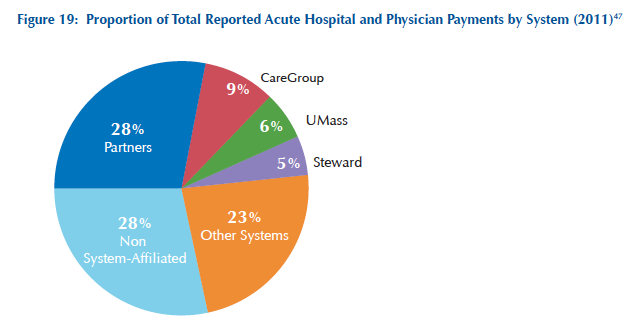
And, let’s not forget, our major insurance carriers are pretty big, too. Blue Cross, Harvard Pilgrim, and Tufts represent nearly 80% of the state’s commercial health insurance market, and their premiums are the highest among all carriers in the Massachusetts market. Whether it’s insurance, hospitals, or physicians, big means more costly.
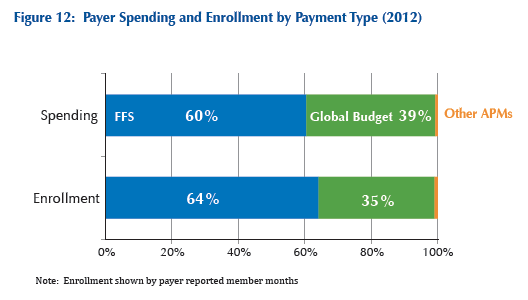
In terms of the Commonwealth’s goal to eliminate most fee-for-service payment in favor of global payment – embodied in the State’s 2012 cost containment law, signed just one year ago — we have a high hill to climb. Fully 60% of commercial spending and 64% of private plan enrollment is fee-for-service. Global budgeting represents between 35 and 39% of the market. Is that high or low? That’s a judgment call, but here’s the benchmark to judge success or failure.
Helpful information and analysis from CHIA.