
Reprinted from the New England Journal of Medicine 324:1253-1258 (May 2), 1991
STEFFIE WOOLHANDLER, M.D., M.P.H., AND DAVID U. HIMMELSTEIN, M.D.
From the Division of Social and Community Medicine. Department of Medicine, Cambridge Hospital and Harvard Medical School, Cambridge, Mass., and the Public Citizen Health Research Group, Washington, D.C. Address reprint requests to Dr. Himmelstein at 1493 Cambridge St., Cambridge. MA 02139.
Abstract Background and Methods. In 1983 the proportion of health care expenditures consumed by administration in the United States was 60 percent higher than in Canada and 97 percent higher than in Britain. To asses the effects of recent health policy initiatives on the administrative efficiency of health care, we examined four components of administrative costs in the United States and Canada for 1987: insurance overhead, hospital administration, nursing home administration, and physicians’ billing and overhead expenses. Most data were provided by the two nations’ federal health and statistics agencies, supplemented by state and provincial data and published sources. Because data on physicians’ billing costs were limited, we estimated a range for these costs by two methods that rely on different sources of data. All figures are reported in 1987 U.S. dollars.
Results. In 1987 health care administration cost between $96.8 billion and $120.4 billion in the United States, amounting in 19.3 to 24.1 percent of total spending on health care, or $400 to $497 per capita. In Canada, between 8.4 and 11.1 percent of health care spending ($117 to $156 per capita) was devoted to administration. Administrative costs in the United States increased 37 percent in real dollars between 1983 and 1987, whereas in Canada they declined. The proportion of health care spending consumed by administration is now at least 117 percent higher in the United States than in Canada and accounts for about half the total difference in health care spending between the two nations. If health care had been as
efficient as in Canada, $69.0 billion to $83.2 billion would have been saved in 1987.
Conclusions. The administrative structure of the U.S. health care system is increasingly inefficient as compared with that of Canada’s national health program. Recent health policies with the avowed goal of improving the efficiency of care have imposed substantial new bureaucratic costs and burdens. (N Engl J Med 1991; 324:1253-8.)
MEDICINE is increasingly a spectator sport. Doctors, patients, and nurses perform before an enlarging audience of utilization reviewers, efficiency experts, and cost managers (Fig. 1) .A cynic viewing the uninflected curve of rising health care spending might wonder whether the cost-containment experts cost more than they contain; one is reminded of the Chinese proverb "There is no use going to bed early to save candles if the result is twins."
In 1983 the proportion of health care spending consumed by administrative costs in the United States was 60 percent higher than in Canada and 97 percent higher than in Britain.2 Recent U .S. health policies have increased bureaucratic burdens and curtailed access to care. Yet they have failed to contain overall costs. This study updates and expands estimates of the costs of health administration in North America through 1987.2 The results demonstrate that the bureaucratic profligacy of the U.S. health care system has increased sharply, while in Canada the proportion of spending on health care consumed by administration has declined.
METHODS
We examined four components of administrative costs in the United States and Canada: insurance overhead, hospital administration, nursing home administration, and physicians' overhead and billing expenses. All estimates are for fiscal year 1987, the most recent year for which complete data were available. Costs are reported in 1987 U.S. dollars, based on the 1987 exchange rate of $1.33 (Canadian) = $1 (U.S.); calculations of per capita spending were based on populations of 243,934,000 in the United States and 25,652,000 in Canada.
Figures on insurance overhead in the United States were obtained from the Health Care Financing Administration.3 Although nationwide data on the costs of hospital and nursing home administration were not available, the California Health Facilities Commission regularly compiles detailed cost data, based on Medicare cost reports, on that state's hospitals and nursing homes. Four years ago we confirmed that administrative costs in California's health facilities were similar to those in at least two other states.2 Since then, trends in hospital and nursing home financing and organization in California have paralleled developments in the nation as a whole.4,5 We computed total hospital administrative costs by summing costs in the following categories: general accounting, patient accounting, credit and collection, admitting, other fiscal services, hospital administration, public relations, personnel department, auxiliary groups, data processing, communications, purchasing, medical library, medical records, medical-staff administration, nursing administration, in-service education, and other administrative services. We excluded costs attributed to research administration, administration of educational programs, printing and duplicating, depreciation, amortization, leases and rentals, insurance, licenses, taxes, central services and supply, other ancillary services, and unassigned costs. We assumed that administration represented the same proportion of total hospital costs in California as nationwide. We derived estimates of nationwide administrative costs for nursing homes from the California data in a similar manner.
Although Canada's 10 provincial health programs differ in some details, they share common structural features that tend to streamline bureaucracy. Each program provides comprehensive coverage for virtually all provincial residents under a single publicly administered plan. Private insurance may cover additional services, but duplication of the public coverage is proscribed; hospitals are paid a lump-sum (global) amount to cover operating expenses, and physicians bill the program directly for all fees.
The Health Statistics Branch of Health and Welfare Canada and Statistics Canada's Canadian Center for Health Information provided unpublished data on nationwide spending for insurance, hospitals, and nursing homes. These data were derived from the provincial governments' reports of their expenditures for insurance administration and from detailed cost reports submitted by hospitals and nursing homes. We computed total hospital administrative costs by summing costs in the following categories: hospital administration ("other"), advertising, association-membership fees, business machines, collection fees, postage, auditing and accounting fees, other professional fees (such as legal fees but excluding medical fees), service-bureau fees, telephone and telegraph, indemnity to board members, travel and convention expenses, medical records and hospital library, and nursing administration. We excluded administrative and support services for educational and research programs, insurance, interest, printing, stationery and office supplies, materiel management, and central supply. Statistics Canada tabulates administrative costs for nursing homes as a single category. These data are less reliable than the hospital figures, since cost reporting by nursing homes is voluntary, and the number of facilities reporting varies substantially from year to year.
We confirmed the accuracy of the Canadian federal data, using more detailed but incomplete data from British Columbia, the Maritimes, Ontario, Quebec, and Saskatchewan6-10 (and personal communications: Cunningham D, British Columbia Ministry of Health; Lim P, Continuing Care Employee Relations Association of British Columbia; and Davis J, Ontario Ministry of Health). Because these data generally matched the national figures, we have not reported them separately.
Only indirect or incomplete information is available on the billing costs of Canadian and U.S. physicians. We therefore used two different methods to estimate these costs, one based on physicians' reports of their professional expenses and the other on the numbers of employees in physicians' offices. The expense-based method (Method I) probably overestimates the actual difference in billing costs between the two nations, whereas the personnel-based approach (Method 2) may underestimate the difference.
Our first approach, Method I, rests on the assumption that the entire difference in physicians' billing and overhead expenses (excluding malpractice premiums11,12) between the United States and Canada is attributable to the excess administrative costs borne by American doctors. The American Medical Association (AMA) estimates U.S. physicians' incomes and practice expenses on the basis of the results of a survey of a representative sample of nonfederal, practicing physicians (excluding interns and residents).12 Revenue Canada tabulates physicians' professional expenses on the basis of tax returns (Rehmer L, Health Information Division, Health and Welfare Canada: personal communication). Because these figures are "distorted, primarily because of the way group practice physicians tend to report expenses" (Rehmer L, Health Information Division, Health and Welfare Canada: personal communication), we used Revenue Canada's corrected tabulation, which included only the 91 percent of physicians who reported professional expenses amounting to between 5 percent and 300 percent of their net in- comes. We added to both the U.S. and Canadian figures an estimate of the value of the physicians' time devoted to billing13 (and Peachey D: personal communication); we assumed that this time was valued at the same rate as other professional activity.
Using Method 2, we also estimated physicians' billing costs on the basis of data on the number of clerical and managerial personnel employed in their offices, as well as the costs of outside billing services. For the United States, we obtained information on physicians' office personnel from data tapes from the Census Bureau's March 1988 Current Population Survey (CPS).14 Since comparable survey data were unavailable for Canada, we used information from a detailed study of office staffing patterns in the province of Quebec in 1977.15 These earlier figures were slightly higher than informal current estimates provided by the Ontario Medical Association (Peachey D: personal communication). For both the United States and Canada, we assumed that the total annual cost per employee averaged $35,000 (including wages, benefits, taxes, work space, equipment, telephone, supplies, and other costs attributable to the employee) and that the ratio of clerical workers to physicians (excluding residents) was identical in offices and other settings. We added to both the U.S. and Canadian figures estimates of the value of physicians' personal time spent on billing, calculated as described above. For the United States we added the cost of outside billing services as determined by a recent survey by the AMA.13
Finally, to evaluate trends over time, we recalculated the 1987 figures to maintain strict comparability with the less detailed and less complete data for 1983.2 As in our earlier paper,2 we estimated physicians' billing and overhead costs by the expense-based method (Method I). However, we excluded the cost of physicians' time spent on billing because comparable data were unavailable for 1983. In keeping with our earlier method, we included malpractice costs in physicians' overhead expenses but corrected for increases over time in these costs.11,12,16 For each country we took average total professional expenses in 1987, subtracted the average 1987 malpractice premium, then added the average 1983 malpractice premium (all expressed as a percentage of gross income). The 1983 figures were converted to 1987 dollars with use of the gross-domestic-prodct price index for each country.17
RESULTS
Insurance Overhead
In 1987 private insurance firms in the United States retained $18.7 billion for administration and profits out of total premium revenues of $157.8 billion.3 Their average overhead costs (11.9 percent of premiums) were considerably higher than the 3.2 percent administrative costs of government health programs such as Medicare and Medicaid ($6.6 billion out of total expenditures of $207.3 billion).3 Together, administration of private and public insurance programs consumed 5.1 percent of the $500.3 billion spent for health care, or $106 per capita.
The overhead costs for Canada's provincial insurance plans amounted to $235 million (0.9 percent) of the $26.57 billion spent by the plans17 (and Health Information Division, Health and Welfare Canada: personal communication). The administrative costs of Canadian private insurers averaged 10.9 percent of premiums ($200 million of the $1.83 billion spent for such coverage) (Health Information Division, Health and Welfare Canada: personal communication). Total administrative costs for Canadian health insurance consumed 1.2 percent of health care spending, or $17 per capita.
Hospital Administration
Hospital administration represented 20.2 percent of hospital costs in California in 1987-1988.18 Extrapolating this figure to the total U .S. hospital expenditures of $194.7 billion in 19872 yielded an estimate of $39.3 billion, or $162 per capita, consumed by hospital administration. In Canada, hospital administration cost $1.27 billion, amounting to 9.0 percent of total hospital expenditures of $14.14 billion (Health Information Division, Health and Welfare Canada: personal communication), or $50 per capita.
Nursing Home Administration
The administrative costs in California's nursing homes accounted for 15.8 percent of total revenues in 1987-1988.19 On the basis of this figure, we estimate that administration cost $6.4 billion of the $40.6 billion spent nationally for nursing home care,3 or $26 per capita. Canadian nursing homes spent $231 million on administration in 1987-1988, amounting to 13.7 percent of the total expenditures of $1.69 billion (Statistics Canada, Canadian Center for Health Information: personal communication), or $9 per capita.
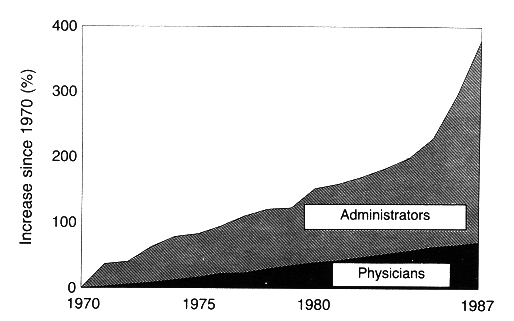
Figure 1. Growth in the Numbers of Physicians and Health Care Administrators from 1970 to 1987.
The data are from Statistical Abstract of the United States for these years (Table 64-2, 109th edition).1 Because of a modification in the Bureau of the Census' definition of "health administrators," the change between 1982 and 1983 is interpolated rather than actual.
Physicians' Billing Expense
Method 1
When calculated according to Method 1, U .S. physicians' overhead and billing expenses, excluding malpractice premiums, made up 43.7 percent of their gross professional income12 - $44.9 billion of the $102.7 billion spent for physicians' services.3 In addition, physicians spent an average of six minutes on each Medicare and Blue Shield claim.13 Assuming that the time required to bill other insurers was similar, the average physician spent about 134.4 hours per year (4.4 percent of his or her total professional activity) on billing; this time had a total value of $4.5 billion. Thus, the total value of U .S. physicians' billing and overhead was $49.4 billion, or $203 per capita.
Canadian physicians' professional expenses, excluding malpractice premiums, amounted to $1.99 billion, or 34.4 percent of their gross income (Rehmer L: personal communication). According to the director of professional affairs of the Ontario Medical Association, "The commitment of time to billing . . . is trivial and can be measured in seconds [per claim]" (Peachey D: personal communication). Assuming that the average physician spends 1 percent of his or her professional time on billing, with a total value of $58 million annually, the total cost of physicians' billing and overhead was $2.04 billion, or $80 per capita.
Method 2
The average office-based physician in the United States employed 1.47 clerical and managerial workers (Himmelstein DU, Woolhandler S: unpublished data), at an annual cost of $51,564 per physician, for a total of $20.0 billion. As calculated above (Method 1), the time physicians spent on billing was valued at $4.5 billion. In addition, 13.9 percent of physicians contracted with outside billing firms, at an average annual cost of $23,196 each,13 for a total of $1.3 billion. Physicians' total billing and clerical expenses amounted to $25.8 billion, or $106 per capita.
The average office-based general practitioner in Quebec employed 0.733 receptionists and secretaries15 at an annual cost of $25,655 per physician, for a total of $1.0 billion for Canadian physicians. In addition, the time physicians spent on billing was valued at $58 million. Physicians' total billing and clerical expenses were thus $1.06 billion, or $41 per capita.
Total Costs of Administration
Table 1 summarizes the per capita costs of health care administration in the United States and Canada, including physicians' billing and overhead costs as calculated by the two different methods. Overall expenditures for health care administration in the United States totaled $96.8 billion to $120.4 billion ($400 to $497 per capita), accounting for 19.3 to 24.1 percent of the $500.3 billion spent for health care. Canadians spent $3.00 billion to $3.98 billion for health care administration ($117 to $156 per capita), amounting to 8.4 to 11.1 percent of the $35.9 billion spent for health care. The difference of $283 to $341 in the per capita cost of health care administration and billing accounted for 43.5 to 52.5 percent of the total difference in health spending between the two nations. If U.S. health care administration had been as efficient as Canada's, $69.0 to $83.2 billion (13.8 to 16.6 percent of total spending on health care) would have been saved in 1987.
The difference between the United States and Canada in billing and administrative costs has markedly increased since 1983.2 Insurance overhead in the United States has risen from 4.4 percent to 5.1 percent of total health care spending, whereas insurance overhead in Canada has declined from 2.5 percent to 1.2 percent.2 Hospital administrative costs have risen from 18.3 percent to 20.2 percent of total hospital spending in the United States, whereas in Canada these costs have climbed slightly from 8.0 percent to 9.0 percent.2 Administrative expenses in U.S. nursing homes rose from 14.4 percent to 15.8 percent of costs, whereas administration's share of total costs rose from 10.5 to 13.7 percent in Canada.2 Physicians' professional expenses (excluding malpractice premiums) have increased from 41.4 percent to 43.8 percent of gross income in the United States, whereas the Canadian figure declined from 35.5 percent to 34.4 percent.2
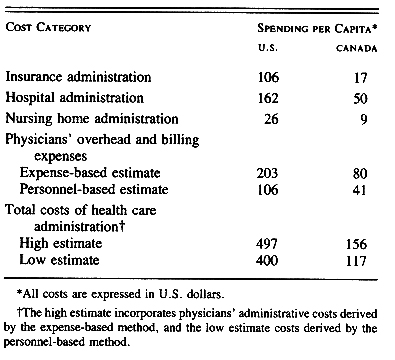
Table 1. Cost of Health Care Administration in the United States and Canada, 1987.
When we recalculated the 1987 figures to maintain comparability with the less complete 1983 data, we found that U.S. administrative costs rose from 21.9 percent to 23.9 percent of health care spending between 1983 and 1987, whereas in Canada administrative costs declined from 13.7 percent to 11.0 percent.2 After adjustment for inflation, the divergence was even more striking. The costs of the health care bureaucracy in the United States rose by $32.2 billion (37 percent) between 1983 and 1987, an increase of $118 per capita. Administrative costs in the Canadian health care system fell by $161 million during this period, a decrease of $6 per capita.
DISCUSSION
Most of our analysis is based on well-substantiated data, although in some areas reliable figures are sparse. The comparability of the data on hospital administrative costs in Canada and the United States is uncertain. However, we relied on detailed budgetary categories that appeared closely matched in the two nations. Although data on the administrative costs of health maintenance organizations are limited, they do not appear to differ substantially from those in the U .S. fee-for-service sector.20-22
Both of our methods for estimating physicians' billing costs are imprecise. The expense-based method (Method 1) may overstate the difference between the United States and Canada, since it assumes that the entire discrepancy in the proportion of income devoted to professional expenses was accounted for by mal- practice premiums, billing, and administration. The personnel-based method (Method 2) may understate the difference because it assumes that aides and other clinical personnel employed in physicians' offices per- formed no activities related to billing, that the total annual cost per clerical worker was no less in Canada than in the United States, and that Canadian billing operations have not been streamlined since 1977 despite computerization. An official of the Ontario Medical Association estimates that electronic claims submission and reconciliation takes about one sixth as much staff time as paper-based billing (Peachey D: personal communication).
In the United States, clerical and managerial staff accounted for 59.5 percent of the nonphysician employees in doctors' offices in 1988, and 74,700 more were added over the ensuing two years (Himmelstein DU, Woolhandler S: unpublished data). In contrast, technicians and technologists accounted for only 7.3 percent of nonphysician office workers in 1988 and for only 5.7 percent in 1990 (Himmelstein DU, Woolhandler S: unpublished data). In 1988, the staff in a typical U.S. physician's office spent about one hour on each Blue Shield or Medicare claim,13 at least 20 times more than in Ontario (Peachey D: personal communication; Weinkauf D: personal communication). In a typical practice in Canada, "One person does all the billing, bookkeeping and typing . . . for 8 physicians."23
Our estimates omit the administrative costs of union and employer health-benefit programs and the administrative work done by hospital nurses and other nonphysician clinical personnel- all probably greater in the United States than in Canada. Moreover, patients in the United States spend far more time (and anguish) on insurance paperwork than do Canadians; these costs are not reflected in our figures. On the other hand, some argue that funding health services through taxes, as in Canada, erodes productivity throughout the economy by discouraging work and investment - the so-called dead-weight loss.24 Within the range of tax rates in North America, however, the magnitude, and even existence, of this dead-weight loss is controversial.25
The United States spent 37 percent more in real dollars on health administration in 1987 than in 1983.2 The recent quest for efficiency has apparently amplified inefficiency. Cost-containment programs predicated on stringent scrutiny of the clinical encounter have required an army of bureaucrats to eliminate modest amounts of unnecessary care. Each piece of medical terrain is meticulously inspected except that beneath the inspectors' feet. Paradoxically, the cost-management industry is among the fastest-growing segments of the health care economy and is expected to generate $7 billion in revenues by 1993.26 The focus on micromanagement has obscured the "fundamentally inefficient structure required to implement such policies. In contrast, Canada has evolved simple mechanisms to enforce an overall budget, but it allows doctors and patients wide latitude in deciding how the funds are spent. Reducing our administrative costs to Canadian levels would save enough money to fund coverage for all uninsured and underinsured Americans.27 Universal comprehensive coverage under a single, publicly administered insurance program is the sine qua non of such administrative simplification.
The fragmented and complex payment structure of the U.S. health care system is inherently less efficient than the Canadian single-payer system. The existence of numerous insurers necessitates determinations of eligibility that would be superfluous if everyone were covered under a single, comprehensive program. Rather than a single claims-processing apparatus in each region, there are hundreds. Fragmentation also reduces the size of the insured group, limiting savings from economies of scale. Insurance overhead for U.S. employee groups with fewer than 5 members is 40 percent of premiums but falls to 5.5 percent for groups of more than 10,000.28 Competition among insurers leads to marketing and cost shifting, which benefit the individual insurance firm but raise systemwide costs.
A lack of comprehensiveness in coverage also drives up administrative costs. Copayments, deductibles, and exclusions are expensive to enforce and lead many enrollees to purchase secondary "Medigap" policies. The secondary insurers maintain redundant and ex- pensive bureaucracies.29
The efficiency of U.S. health care is further compromised by the extensive participation of private insurance firms whose overhead consumes 11.9 percent of premiums, as compared with 3.2 percent in U .S. public programs.3 Even the "public" figure reflects the inefficiency of the private firms that process claims for Medicare for an average of $2.74 per claim,30 whereas Ontario's Ministry of Health processes claims for $0.41 each (Davis J: personal communication). Moreover, the inefficiency of private insurers is not unique to the United States. The small private-insurance sectors of Canada, the United Kingdom, and Germany have overheads of 10.9 percent, 16 percent, and 15.7 percent, respectively.31,32 A major advantage of public programs in terms of efficiency is their use of existing tax-collection structures, obviating the need for a redundant bureaucracy to collect money for health services. Thus, the overhead in Germany's premium- based, quasi-public sickness funds is between 4.6 percent33 and 4.8 percent (Kuhn H: personal communication) - considerably higher than the overhead in tax-funded systems.
The scale of waste among private carriers is illustrated by Blue Cross/Blue Shield of Massachusetts, which covers 2.7 million subscribers and employs 6682 workers34 - more than work for all of Canada's provincial health plans, which together cover more than 25 million people7-10 (and Davis]: personal communication; Cunningham D: personal communication); 435 provincial employees administer the coverage for more than 3 million people in British Columbia (Cunningham D: personal communication).
The existence of multiple payers in the United States also imposes bureaucratic costs on health care providers. Hospitals must bill several insurance programs with varying and voluminous regulations on coverage, eligibility, and documentation. Moreover, billing on a per-patient basis requires an extensive internal accounting apparatus for attributing costs and charges to individual patients and insurers. In contrast, Canada's single-payer system funds hospitals through global budgets, eliminating almost all hospital billing. The striking administrative efficiency of the Shriners' hospitals in the United States, which bill neither patients nor third parties and devote only 2 percent of their revenues to administration,35 suggests that payment mechanisms rather than cultural or political milieus determine administrative costs. Here, too, the European experience parallels North America's. British hospitals that are assigned global budgets devote 6.9 percent of spending to administration,36 but those paid on a per-patient basis (such as Humana's Wellington Hospital in London) spend 18 percent.37
The synchronous growth of bureaucratic profligacy and unmet health needs is reminiscent of Dickens' somber tale of six poor travelers who were relegated to outbuildings when the hostel built for them was fully occupied by its charitable administrators.
I found, too, that about a thirtieth part of the annual revenue was now expended on the purposes commemorated in the inscription over the door; the rest being handsomely laid out in Chancery, law expenses, collectorship, receivership, poundage, and other appendages of management, highly complimentary to the importance of the six Poor Travellers.38
The house of medicine is host to a growing array of specialists in fields unconnected to healing. At its present rate of growth, administration will consume a third of spending on health care 12 years hence, and half of the health care budget in the year 2020.
We are indebted to Mr. Lothar Rehmer, Ms.Judith Dowler, Dr. Jane Fulton, and Mr. Gilles Fortin for providing much of the raw data on Canadian health spending and to Dr. David H. Bor for his invaluable advice.
REFERENCES
1. Bureau of the Census. Statistical abstract of the United States. 102nd-I09th eds. Washington, D.C. Government Printing Office, 1981-1989.
2. Himmelstein DU, Woolhandler S. Cost without benefit: administrative waste in U.S. health care. N Engl J Med 1986; 314:441-5.
3. Letsch SW, Levit KR, Waldo DR. National health expenditures, 1987. Health Care Financ Rev 1988; 10(2): 109-22.
4. American Hospital Association. Hospital statistics: 1984 ed. Chicago: American Hospital Association, 1984.
5. Idem. Hospital statistics: 1988 ed. Chicago. American Hospital Association, 1988.
6. Hospital statistics 1986-1987. Toronto: Queen's Printer, 1987.
7. Ontario Ministry of Health. Annual report 1988-89. Kingston: Ontario Ministry of Health, 1989.
8. Regie de L'assurance-maladie du Quebec. Rapport Annuel 1986-1987. Quebec: Government of Quebec, 1987:30.
9. Saskatchewan Medical Care Insurance Commission. Annual report 1985- 86. Regina: Government of Saskatchewan, 1986.
10. Nova Scotia Medical Services Insurance. Annual statistical tables: fiscal year 1985-86. Halifax: Government of Nova Scotia, 1986.3.
11. Canadian Medical Protective Association (CMPA) membership fees, 1971-1990. Toronto: Canadian Medical Association, 1989.
12. Gonzalez ML, Emmons DW, eds. Socioeconomic characteristics of medical practice 1989. Chicago: American Medical Association, 1989.
13. AMA Center for Health Policy Research. The administrative burden of health insurance on physicians. SMS Report 1989; 3(2): 2-4.
14. Bureau of the Census. Current population survey, March 1988: technical documentation. Washington, D.C. Department of Commerce, 1988.
15. Berry C, Brewster IA, Held PI, Kehrer BH, Manheim LM, Reinhardt U. A study of the responses of Canadian physicians to the introduction of universal medical care insurance: the first five years in Quebec. Princeton, N.I.: Mathematica Policy Research, 1978.
16. Reynolds RA, Abram JB, eds. Socioeconomic characteristics of medical practice 1983. Chicago. American Medical Association, 1983.
17. Poullier J-P. Compendium: health care expenditure and other data. Health Care Financ Rev 1989; 11:Suppl: 111-94.
18. Aggregate hospital financial data for California: report periods ending June 30, 1987-June 29, 1988. Sacramento: California Health Facilities Commission, 1989.
19. Aggregate long-term care facility financial data: report periods ending December 31, 1987-December 30, 1988. Sacramento: California Health Facilities Commission, 1989.
20. PHS will be challenged to maintain unbroken streak of profitability. Mod Healthcare 1989; 19(31): 32-4.
21. Kenkel PJ. Improving managed care's management. Mod Healthcare 1990; 20(19)"27-34.
22. Idem. Medicaid HMOs struggle for viability: federal plan aims to ease the burden. Mod Healthcare 1990; 20(16): 32.
23. Gerber PC. What your life would be like under a Canadian-type NHI. Physician's Manage 1990; 30(5): 32-9.
24. Ballad CA, Shoven JB, Wholley J. The total welfare costs of the U.S. tax system: a general equilibrium approach. Natl Tax J 1985; 38:125- 40.
25. MacEwan A, Campen J. Crisis, contradiction, and conservative controversies in contemporary U.S. capitalism. Rev Radical Polit Econ 1982; 14(3): 1-22.
26. Cost-management industry grew in 1988. Mod Healthcare 1989; 19(33): 64.
27. Woolhandler S, Himmelstein DU. Free care: a quantitative analysis of health and cost effects of a national health program for the United States. lnt J Health Serv 1988; 18:393-9.
28. Congressional Research Service, Library of Congress. Cost and effects of extending health insurance coverage. Washington, D.C.: Government Print- ing Office, 1988. (Education and Labor serial number 100-EE.)
29. Statement of Janet L. Shikles, Director, Health Financing and Policy Issues, Human Resources Division, General Accounting Office, before the Sub-committee of Health, Committee on Ways and Means, U.S. House of Representatives, March 13, 1990. Washington, D.C.: Government Printing Office, 1990. (SUDOC no. GAO/T-HRD-90-16.)
30. Statement of Janet L. Shikles, Director, Health Financing and Policy issues, Human Resources Division, General Accounting Office, before the Sub- committee on Health, Committee on Ways and Means, U.S. House of Representatives, June 14, 1990. Washington, D.C.: Government Printing Office, 1990. (SUDOC no. GAO/T-HRD-90-42.)
31. Vayda E. Private practice in the United Kingdom: a growing concern. J Public Health Policy 1989; 10:359-76.
32. Verband der privaten Krankenversicherung e. V. Die private Krankenversicherung, Zahlenbericht 1988/1989.
33. Die gesetzliche Krankenversicherung in der Bundesrepublik Deutschland im Jahre 1988. Bonn, Germany. Bundesministerium fur Arbeit und Sozialordnung, 1989.
34. Blue Cross/Blue Shield corporate report. Boston: Blue Cross/Blue Shield of Massachusetts, May 1990.
35. Guest DB. Health care policies in the United States: can the "American Way" succeed? Lancet 1985; 2: 997-1000.
36. Compendium of health statistics. London: Office of Health Economics, 1984. 37. Parker P. A free market in health care. Lancet 1988, 1: 1210-4.
38. Dickens C. Seven poor travellers. In: Dickens the Younger C, ed. Stories from the Christmas numbers of "Household Words" and "All the Year Round" 1852-1867. New York: Macmillan, 1896.
©Copyright, 1991, by the Massachusetts Medical Society Printed in the U.S.A.